Texans vs Colts match player stats
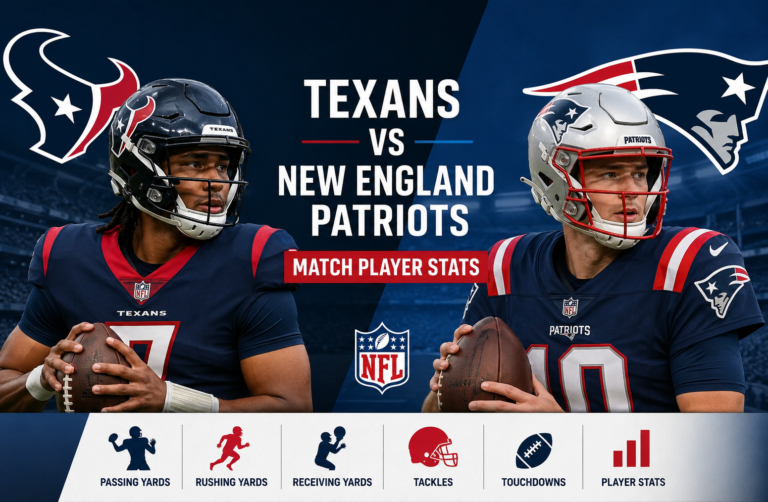
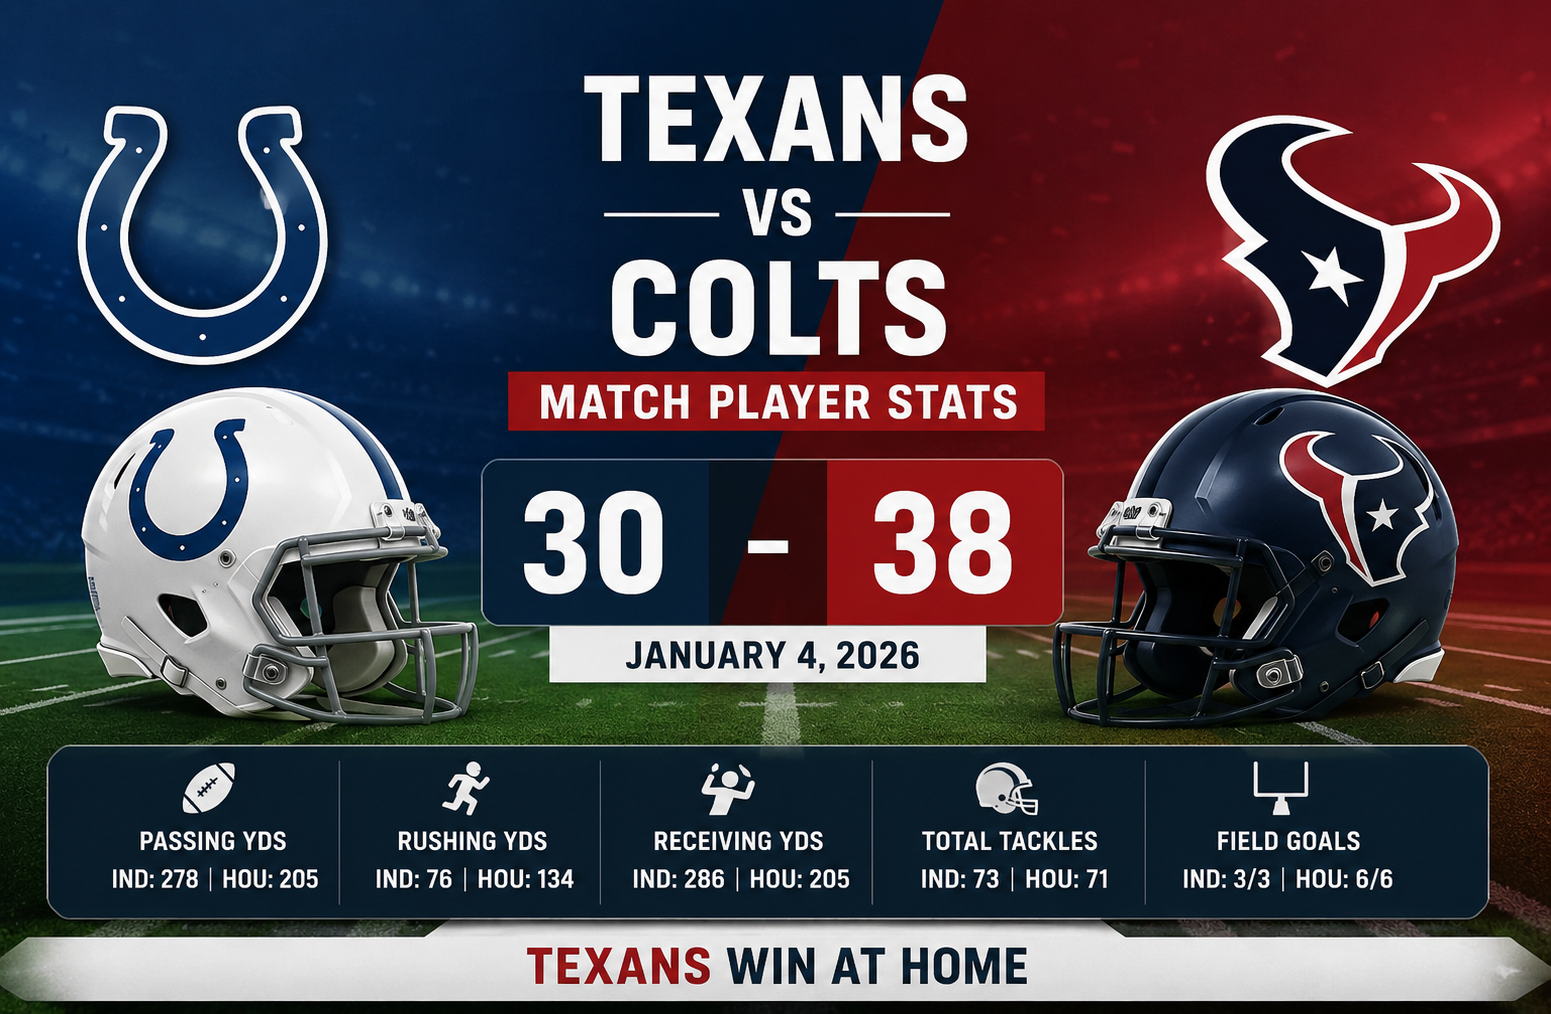
The texans vs colts match player stats from January 4, 2026 tell a much more interesting story than the 38-30 final score alone. Houston defeated Indianapolis at home, finishing the game with a 12-5 record compared with Indianapolis at 8-9. The Texans were more efficient on the ground, protected the football better, and received a perfect kicking performance from Ka’imi Fairbairn. Indianapolis, however, created major explosive plays through Alec Pierce and moved the ball effectively through the air with Riley Leonard.
The final score was Houston Texans 38, Indianapolis Colts 30. Houston scored 6 points in the first quarter, 17 in the second, 3 in the third and 12 in the fourth. Indianapolis scored 10, 7, 10 and 3 points across the four quarters. That scoring pattern shows why the game remained competitive for long stretches before Houston closed it out.
This article breaks down the complete player production, including passing, rushing, receiving, defense, turnovers, kicking, returns and the statistical factors that separated the two teams.
Texans vs Colts Match Player Stats at a Glance
| Category | Indianapolis Colts | Houston Texans |
| Final Score | 30 | 38 |
| Record | 8-9 | 12-5 |
| Passing Yards | 278 | 205 |
| Rushing Yards | 76 | 134 |
| Total Offensive Yards | 354 | 339 |
| Passing Attempts | 35 | 32 |
| Rushing Attempts | 28 | 32 |
| Team Passing TDs | 2 | 1 |
| Team Rushing TDs | 1 | 1 |
| Turnovers Lost | 2 | 0 |
| Field Goals | 3/3 | 6/6 |
| Total Points | 30 | 38 |
One of the most important details is that Indianapolis actually produced more total offensive yards, 354 to 339. Yet Houston won by eight points.
That is a useful reminder that raw yardage does not always determine the winner. Houston’s advantage came from efficiency in key areas, especially rushing, turnover avoidance and field-goal production.
How the Game Was Decided
The statistical profile of this matchup can be divided into four major themes:
- Houston ran the ball more effectively.
- Indianapolis generated bigger passing plays.
- Houston won the turnover battle decisively.
- Houston’s kicking game converted every scoring opportunity.
The Colts averaged only 2.7 yards per rushing attempt, while Houston averaged 4.2. Indianapolis had 28 rushing attempts for 76 yards, whereas Houston had 32 attempts for 134 yards.
At the same time, Indianapolis gained 278 passing yards compared with Houston’s 205. The Colts also averaged 13.0 yards per reception as a team, significantly higher than Houston’s 12.1.
This created an unusual offensive contrast. Indianapolis was more productive through the air, while Houston was more balanced and more effective on the ground.
Riley Leonard Passing Performance
Riley Leonard was Indianapolis’ primary passer and completed 21 of 34 attempts for 270 yards, averaging 7.9 yards per attempt.
He threw:
- 2 touchdowns
- 1 interception
- 1 sack for 8 yards
- 83.9 QBR
- 94.0 passer rating
The numbers show that Leonard was capable of producing a strong passing performance even though Indianapolis lost.
His 270 passing yards represented almost all of the Colts’ conventional quarterback production. Rigoberto Sanchez added one completion on one attempt for 16 yards, meaning the Indianapolis team finished with 22 completions on 35 attempts for 278 yards.
Leonard’s 7.9 yards per attempt is particularly important. It indicates that Indianapolis was not simply moving the ball through short, conservative completions. The Colts were willing and able to generate meaningful yardage through the passing game.
Leonard’s Impact on the Score
Leonard also contributed as a runner.
He carried the ball three times for 21 yards, averaging 7.0 yards per attempt, with a long run of 11 yards. Most importantly, he scored one rushing touchdown.
That gave Indianapolis another scoring dimension and helped keep the offense productive despite the struggles of the rushing attack.
However, Leonard also lost two fumbles. Those turnovers became one of the biggest statistical disadvantages for Indianapolis.
A quarterback can produce strong passing numbers and still have a negative overall impact if turnovers erase valuable possessions.
That is an important lesson from this matchup.
C.J. Stroud’s Passing Numbers
C.J. Stroud completed 14 of 23 passes for 169 yards, averaging 7.3 yards per attempt.
His passing line included:
- 1 touchdown
- 0 interceptions
- 59.2 QBR
- 97.9 passer rating
Stroud did not match Leonard’s passing yardage. He also attempted 11 fewer passes.
Yet the Texans did not need Stroud to produce 300-plus passing yards because their running game supplied 134 yards on 32 attempts.
Stroud also contributed on the ground with two carries for five yards and one rushing touchdown.
That touchdown is particularly relevant when evaluating the quarterback’s total scoring contribution. His passing numbers were relatively modest, but his combination of zero interceptions and a rushing score helped Houston maintain control.
Houston’s Quarterback Depth
Davis Mills also appeared in the game.
He completed 3 of 9 passes for 36 yards, averaging 4.0 yards per attempt. He did not throw a touchdown or interception and recorded a 46.5 passer rating.
Mills also rushed once for 12 yards.
Houston therefore finished with 17 completions on 32 attempts for 205 yards. The team recorded one passing touchdown and no interceptions.
From a team perspective, the lack of interceptions was crucial.
Passing Comparison
| Player | Comp/Att | Yards | Yards/Attempt | TD | INT | Rating |
| Riley Leonard | 21/34 | 270 | 7.9 | 2 | 1 | 94.0 |
| Rigoberto Sanchez | 1/1 | 16 | 16.0 | 0 | 0 | 118.8 |
| C.J. Stroud | 14/23 | 169 | 7.3 | 1 | 0 | 97.9 |
| Davis Mills | 3/9 | 36 | 4.0 | 0 | 0 | 46.5 |
Leonard had the larger passing workload and more yardage. Stroud, however, avoided the interception and played within an offense that produced 134 rushing yards.
That difference in offensive balance matters.
Texans vs Colts Match Player Stats: Rushing Breakdown
The rushing statistics strongly favor Houston.
Indianapolis managed 76 rushing yards on 28 attempts. Houston produced 134 yards on 32 attempts.
That is a difference of 58 rushing yards despite only four additional rushing attempts for Houston.
Indianapolis Rushing Leaders
DJ Giddens led Indianapolis with:
- 8 carries
- 30 yards
- 3.8 yards per carry
- 0 touchdowns
- 9-yard long
Jonathan Taylor carried 14 times for 26 yards, averaging just 1.9 yards per attempt.
That was one of the most difficult areas for Indianapolis.
Taylor normally represents a major component of the Colts’ offensive identity, but his production in this game was limited. His longest rush was only eight yards.
Riley Leonard was actually more efficient on a per-carry basis, gaining 21 yards on three attempts.
Tyler Goodson added three yards on one carry, while Ameer Abdullah gained one yard.
Josh Downs recorded a rushing attempt that lost five yards, further reducing Indianapolis’ overall rushing efficiency.
Indianapolis Rushing Table
| Player | Carries | Yards | Average | TD | Long |
| DJ Giddens | 8 | 30 | 3.8 | 0 | 9 |
| Jonathan Taylor | 14 | 26 | 1.9 | 0 | 8 |
| Riley Leonard | 3 | 21 | 7.0 | 1 | 11 |
| Tyler Goodson | 1 | 3 | 3.0 | 0 | 3 |
| Ameer Abdullah | 1 | 1 | 1.0 | 0 | 1 |
| Josh Downs | 1 | -5 | -5.0 | 0 | -5 |
| Team Total | 28 | 76 | 2.7 | 1 | 11 |
The biggest takeaway is not simply that Taylor had 26 yards. It is that Indianapolis could not consistently turn rushing attempts into positive, efficient gains.
That placed more pressure on Leonard and the passing game.
Houston Rushing Leaders
Houston had a much stronger rushing distribution.
British Brooks led the Texans with 13 carries for 63 yards. He averaged 4.8 yards per attempt and had a 20-yard long.
Woody Marks added 48 yards on 10 carries, also averaging 4.8 yards per attempt.
C.J. Stroud contributed five yards and one touchdown on two attempts.
Davis Mills gained 12 yards on one carry.
The Texans also received three yards from Dare Ogunbowale and three yards from Jawhar Jordan, who carried five times.
Houston Rushing Table
| Player | Carries | Yards | Average | TD | Long |
| British Brooks | 13 | 63 | 4.8 | 0 | 20 |
| Woody Marks | 10 | 48 | 4.8 | 0 | 9 |
| Davis Mills | 1 | 12 | 12.0 | 0 | 12 |
| C.J. Stroud | 2 | 5 | 2.5 | 1 | 5 |
| Dare Ogunbowale | 1 | 3 | 3.0 | 0 | 3 |
| Jawhar Jordan | 5 | 3 | 0.6 | 0 | 2 |
| Team Total | 32 | 134 | 4.2 | 1 | 20 |
The important difference is consistency.
Two Houston rushers averaged 4.8 yards per carry and both received meaningful workloads. That allowed the Texans to keep their offense from becoming completely dependent on Stroud.
Alec Pierce Produced the Game’s Biggest Receiving Numbers
Alec Pierce was one of the most explosive players in the matchup.
He caught 4 passes for 132 yards and 2 touchdowns.
His average was an exceptional 33.0 yards per reception, and his longest reception went for 66 yards.
Pierce received seven targets.
Those numbers explain how Indianapolis was able to score 30 points despite producing only 76 rushing yards.
His 132 receiving yards accounted for a huge portion of Indianapolis’ 286 receiving yards.
The two touchdowns were also the only two passing touchdowns credited to the Colts.
Pierce’s production demonstrates why explosive plays can compensate for an inefficient running game. Indianapolis struggled to gain steady rushing yardage, but Pierce repeatedly created field position and scoring opportunities.
Josh Downs Adds Another 61 Receiving Yards
Josh Downs caught four passes for 61 yards.
He averaged 15.3 yards per reception and produced a long of 30 yards on seven targets.
Downs therefore provided another meaningful source of downfield production.
His receiving numbers combined with Pierce’s output gave Indianapolis two major contributors through the passing game.
Tyler Warren’s Role
Tyler Warren caught five passes for 26 yards.
He received four targets and averaged 5.2 yards per reception.
While his yardage total was modest, he led Indianapolis in receptions.
That shows an important distinction between volume and explosiveness. Warren was involved frequently enough to record five catches, while Pierce generated far more yardage with fewer receptions.
Indianapolis Receiving Statistics
| Player | Receptions | Yards | Average | TD | Long | Targets |
| Alec Pierce | 4 | 132 | 33.0 | 2 | 66 | 7 |
| Josh Downs | 4 | 61 | 15.3 | 0 | 30 | 7 |
| Tyler Warren | 5 | 26 | 5.2 | 0 | 9 | 4 |
| Ameer Abdullah | 2 | 24 | 12.0 | 0 | 15 | 8 |
| Mo Alie-Cox | 3 | 22 | 7.3 | 0 | 16 | 2 |
| Jonathan Taylor | 2 | 13 | 6.5 | 0 | 11 | 4 |
| Michael Pittman Jr. | 2 | 11 | 5.5 | 0 | 16 | 2 |
| Ashton Dulin | 0 | 0 | 0.0 | 0 | 0 | Not listed |
| Riley Leonard | 0 | -3 | N/A | 0 | N/A | Not listed |
| Team Total | 22 | 286 | 13.0 | 2 | 66 | 33 |
The receiving table highlights Indianapolis’ big-play identity in this matchup.
Pierce alone averaged more than 33 yards every time he caught the ball.
Xavier Hutchinson Leads Houston Receivers
Xavier Hutchinson led Houston in receiving yards.
He caught five passes for 84 yards on nine targets.
His average was 16.8 yards per reception, with a long reception of 33 yards.
Hutchinson’s production gave Stroud an important option in the passing game.
Dalton Schultz also delivered a strong efficiency performance. He caught four passes for 73 yards on four targets, averaging 18.3 yards per reception.
That means Schultz caught every pass thrown his way according to the supplied statistics.
Houston Receiving Statistics
| Player | Receptions | Yards | Average | TD | Long | Targets |
| Xavier Hutchinson | 5 | 84 | 16.8 | 0 | 33 | 9 |
| Dalton Schultz | 4 | 73 | 18.3 | 0 | 32 | 4 |
| Jayden Higgins | 2 | 23 | 11.5 | 1 | 12 | 5 |
| Jaylin Noel | 1 | 13 | 13.0 | 0 | 13 | 1 |
| Cade Stover | 1 | 9 | 9.0 | 0 | 9 | 2 |
| Dare Ogunbowale | 1 | 6 | 6.0 | 0 | 6 | 2 |
| Woody Marks | 2 | 0 | 0.0 | 0 | 0 | Not listed |
| Christian Kirk | 1 | -3 | -3.0 | 0 | N/A | Not listed |
| Team Total | 17 | 205 | 12.1 | 1 | 33 | 28 |
Houston did not need a single receiver to approach Pierce’s 132 yards.
Instead, the Texans spread their production across Hutchinson, Schultz and several supporting players.
That distribution is one reason the offense remained functional despite Stroud throwing for only 169 yards.
Receiving Efficiency Versus Receiving Volume
The receiving numbers also reveal an interesting contrast.
Indianapolis had:
- 22 receptions
- 286 yards
- 13.0 yards per reception
- 2 touchdowns
- 33 targets
Houston had:
- 17 receptions
- 205 yards
- 12.1 yards per reception
- 1 touchdown
- 28 targets
Indianapolis was more productive in the passing game by yardage.
Yet Houston won.
This is a clear example of why individual passing and receiving statistics should be interpreted alongside turnovers, rushing efficiency and scoring.
Turnovers Were a Major Difference
Indianapolis lost two fumbles.
Both belonged to Riley Leonard.
Houston did not lose a fumble.
The Texans recovered two fumbles, with Tommy Togiai and Henry To’oTo’o each recording a recovery.
Houston also had one interception from Alijah Huzzie.
Indianapolis had no interceptions.
This gave Houston a clear turnover advantage.
Turnover Summary
| Team | Fumbles | Fumbles Lost | Recoveries | Interceptions |
| Indianapolis | 2 | 2 | 0 | 0 |
| Houston | 0 | 0 | 2 | 1 |
The turnover battle is one of the simplest ways to understand why the Colts could gain 354 total offensive yards and still lose by eight.
Indianapolis generated offense, but Houston was better at protecting its possessions.
Every lost possession creates an opportunity for the opponent.
In a game decided by eight points, two lost fumbles are particularly significant.
Defensive Performance
Indianapolis recorded 73 total tackles, including 38 solo tackles.
The Colts recorded:
- 0 sacks
- 3 tackles for loss
- 3 passes defended
- 2 quarterback hits
Houston recorded 71 total tackles, including 36 solo tackles.
The Texans had:
- 1 sack
- 6 tackles for loss
- 6 passes defended
- 3 quarterback hits
- 1 defensive touchdown
The defensive numbers show that Houston created more disruption despite having slightly fewer total tackles.
Zaire Franklin Leads Indianapolis Tacklers
Zaire Franklin finished with 12 tackles, including seven solo tackles.
He also recorded two tackles for loss.
His 12 tackles were the highest total among Indianapolis defenders listed in the supplied data.
Nick Cross recorded six tackles, including three solo tackles.
Adetomiwa Adebawore also recorded six tackles, with three solo tackles and one tackle for loss.
The Colts’ defense stayed active, but the lack of a sack was notable.
Houston Defensive Leaders
Will Anderson Jr. recorded six tackles, four of them solo, along with one tackle for loss.
Damone Clark recorded six tackles, including two solo tackles.
E.J. Speed also finished with six tackles, with one solo tackle.
Houston’s defense also recorded one sack and six tackles for loss.
Alijah Huzzie added the team’s interception.
The supplied statistics also credit Houston’s defense with a touchdown.
That type of defensive scoring contribution can have a major impact on a close game.
Field-Goal Kicking Was a Hidden Difference
Ka’imi Fairbairn delivered a perfect performance for Houston.
He made:
- 6 of 6 field goals
- 100 percent field-goal accuracy
- Long of 51 yards
- 2 of 2 extra points
- 20 total points
Twenty points from one kicker is an enormous contribution.
Blake Grupe was also perfect for Indianapolis, making:
- 3 of 3 field goals
- Long of 50 yards
- 3 of 3 extra points
- 12 total points
Both kickers were reliable.
The difference was opportunity volume.
Fairbairn converted six field goals, while Grupe converted three.
That nine-point difference in field-goal production closely matches the eight-point final margin.
This is one of the clearest statistical clues in the entire game.
Special Teams and Return Production
Houston’s Jaylin Noel led the kick-return numbers.
He recorded six kick returns for 175 yards, averaging 29.2 yards per return, with a long of 43 yards.
That gave Houston strong starting-field-position potential throughout the game.
Indianapolis had four kick returns for 112 yards.
Ashton Dulin recorded two returns for 59 yards, while Ameer Abdullah had two returns for 53 yards.
Josh Downs returned one punt for Indianapolis for 13 yards.
Noel also handled a punt return for Houston, gaining six yards.
Kick Return Comparison
| Player | Returns | Yards | Average | Long |
| Jaylin Noel | 6 | 175 | 29.2 | 43 |
| Ashton Dulin | 2 | 59 | 29.5 | 30 |
| Ameer Abdullah | 2 | 53 | 26.5 | 30 |
Noel’s 175 return yards were particularly valuable because they repeatedly gave Houston an opportunity to begin drives from favorable field position.
Punting Comparison
Rigoberto Sanchez punted twice for Indianapolis.
He produced:
- 90 total punt yards
- 45.0-yard average
- 49-yard long
- 0 touchbacks
- 0 inside the 20
Tommy Townsend punted three times for Houston.
He produced:
- 121 total punt yards
- 40.3-yard average
- 45-yard long
- 0 touchbacks
- 2 inside the 20
Sanchez had the better average, but Townsend placed two punts inside the 20.
That suggests Houston’s punting performance had stronger placement value even though the raw average was lower.
Why Indianapolis Lost Despite More Passing Yards
This is arguably the most important analytical question.
Indianapolis passed for 278 yards compared with Houston’s 205.
The Colts also finished with 354 total offensive yards compared with Houston’s 339.
So why did Houston win?
1. Houston Ran Better
The Texans gained 134 rushing yards compared with 76 for Indianapolis.
Houston averaged 4.2 yards per carry.
Indianapolis averaged only 2.7.
That 58-yard rushing difference helped Houston maintain offensive balance.
2. Houston Protected the Football
Indianapolis lost two fumbles.
Houston lost none.
Houston also recorded an interception.
Turnovers changed the value of the yardage produced by each team.
3. Houston Converted More Kicking Opportunities
Fairbairn scored 20 points.
Grupe scored 12.
Both kickers were perfect, but Houston created more field-goal opportunities.
4. Houston Got Defensive Disruption
The Texans recorded six tackles for loss, one sack, six passes defended and three quarterback hits.
Indianapolis recorded three tackles for loss, no sacks, three passes defended and two quarterback hits.
Houston therefore produced more negative plays.
5. Houston Scored 12 Fourth-Quarter Points
The fourth quarter was decisive.
Indianapolis scored only three points in the final quarter.
Houston scored 12.
That late scoring advantage turned a competitive game into a Houston victory.
The Importance of the Fourth Quarter
The quarter-by-quarter scoring deserves special attention.
| Quarter | Colts | Texans |
| Q1 | 10 | 6 |
| Q2 | 7 | 17 |
| Q3 | 10 | 3 |
| Q4 | 3 | 12 |
| Final | 30 | 38 |
Indianapolis started faster, leading the first quarter 10-6.
Houston responded with a 17-point second quarter.
The Colts then had a strong third quarter, scoring 10 points while Houston managed only three.
That sequence kept the game within reach.
But Houston’s fourth-quarter response was decisive.
The Texans scored 12 points while Indianapolis managed only three.
That eight-point final margin was therefore created by Houston’s ability to finish the game better.
The Most Important Individual Performances
Several players stand out when the complete statistical picture is considered.
Alec Pierce
Pierce was arguably Indianapolis’ most explosive offensive player.
His 132 yards and two touchdowns on four receptions gave him a major impact despite relatively limited reception volume.
Riley Leonard
Leonard threw for 270 yards and two touchdowns while adding 21 rushing yards and a rushing touchdown.
However, his two lost fumbles were a major negative.
British Brooks
Brooks led Houston’s rushing attack with 63 yards on 13 carries.
His 4.8-yard average helped establish Houston’s ground game.
C.J. Stroud
Stroud’s 169 passing yards were modest, but he threw no interceptions and added a rushing touchdown.
His efficiency was supported by Houston’s running game.
Xavier Hutchinson
Hutchinson led Houston in receiving with 84 yards.
His nine targets were the highest target total among Houston receivers listed.
Dalton Schultz
Schultz was especially efficient, catching all four of his targets for 73 yards.
His 18.3 yards per reception was Houston’s highest among its primary receiving contributors.
Ka’imi Fairbairn
Fairbairn scored 20 points and converted all six field-goal attempts.
His performance was one of the biggest reasons Houston was able to convert possessions into points.
What the Statistics Say About Offensive Balance
The matchup provides a useful comparison between two different offensive profiles.
Indianapolis leaned heavily toward passing.
The Colts had 278 passing yards and only 76 rushing yards.
Houston was more balanced.
The Texans produced 205 passing yards and 134 rushing yards.
The combined totals were:
Indianapolis: 354 total yards
Houston: 339 total yards
The Colts actually had 15 more total yards.
But Houston’s distribution was more balanced.
That balance can make an offense less predictable and can help reduce pressure on the quarterback.
What the Statistics Say About Efficiency
Efficiency is often more informative than volume.
Consider these numbers:
Houston rushing: 4.2 yards per carry
Indianapolis rushing: 2.7 yards per carry
Houston passing: 6.4 yards per attempt
Indianapolis passing: 8.2 yards per attempt
The Colts were more efficient in the passing game.
The Texans were more efficient in the running game.
That balance allowed Houston to compensate for its lower passing total.
Why Alec Pierce’s Performance Was Not Enough
Pierce’s 132 yards and two touchdowns were outstanding.
But football is a team sport, and one explosive receiver cannot completely overcome weaknesses elsewhere.
Indianapolis struggled to run the ball.
Taylor averaged only 1.9 yards per carry.
The team lost two fumbles.
The defense failed to record a sack.
And the Colts converted only three field goals compared with Houston’s six.
Pierce created explosive plays, but Houston won more of the smaller statistical battles that collectively shaped the result.
Why Houston’s 12-5 Record Matters
The supplied data lists Houston at 12-5 overall and 7-2 at home.
Indianapolis finished 8-9 overall and 2-6 away.
That context helps explain why the venue mattered.
Houston was highly successful at home during the season, while Indianapolis struggled significantly more on the road.
The game itself reflected that difference.
Houston ultimately delivered the stronger closing performance and finished with the victory.
Key Statistical Lessons From the Game
The matchup provides several lessons for anyone analyzing football player statistics.
Yardage Does Not Equal Victory
Indianapolis gained more total yards but lost the game.
Explosive Plays Can Hide Rushing Problems
The Colts’ passing game produced 286 receiving yards, but the rushing attack averaged only 2.7 yards per carry.
Turnovers Can Overrule Offensive Production
Two lost fumbles significantly damaged Indianapolis.
Field Goals Matter
Fairbairn’s six field goals produced 20 points.
Balance Helps
Houston’s 134 rushing yards reduced the pressure on Stroud.
Fourth-Quarter Execution Matters
Houston outscored Indianapolis 12-3 in the final quarter.
Texans vs Colts Match Player Stats: Final Assessment
The texans vs colts match player stats show that this was not a simple case of one team dominating every category.
Indianapolis had the better passing numbers.
Riley Leonard threw for 270 yards and two touchdowns. Alec Pierce delivered 132 yards and two scores. The Colts finished with 354 total offensive yards.
Houston, however, won the areas that translated more effectively into points.
The Texans rushed for 134 yards, averaged 4.2 yards per carry, avoided turnovers, generated more defensive disruption and received 20 points from Fairbairn.
C.J. Stroud’s passing line was not spectacular, but he avoided interceptions and added a rushing touchdown.
British Brooks and Woody Marks combined for 111 rushing yards at an identical 4.8 yards per carry.
On defense, Houston recorded twice as many tackles for loss as Indianapolis and added a sack and an interception.
The fourth quarter ultimately provided the clearest answer.
Houston scored 12 points.
Indianapolis scored three.
That finishing advantage produced the 38-30 victory.
For anyone studying the game through player statistics, the biggest takeaway is that Indianapolis produced more offensive yardage, but Houston produced a more efficient winning formula. The Texans combined rushing efficiency, turnover protection, defensive disruption, return production and reliable kicking.
That combination was enough to overcome the Colts’ superior passing yardage.
Frequently Asked Questions
Who won the Texans vs Colts game on January 4, 2026?
The Houston Texans defeated the Indianapolis Colts 38-30 at home on January 4, 2026.
Who was the leading passer for Indianapolis?
Riley Leonard led Indianapolis with 21 completions on 34 attempts for 270 yards, two touchdowns and one interception.
Who led Houston in rushing?
British Brooks led Houston with 13 carries for 63 yards, averaging 4.8 yards per carry.
Who had the most receiving yards?
Alec Pierce led all listed receivers with 132 yards on four receptions. He also scored two touchdowns.
How many turnovers did each team lose?
Indianapolis lost two fumbles. Houston lost no turnovers.
Who scored the most points?
Houston kicker Ka’imi Fairbairn scored 20 points by making six field goals and two extra points.
Conclusion
The final 38-30 score does not fully explain the statistical story of this matchup.
Indianapolis moved the football effectively through the air and produced 354 total yards. Riley Leonard delivered 270 passing yards, while Alec Pierce produced 132 receiving yards and two touchdowns. Those numbers show that the Colts had plenty of offensive firepower.
Houston’s advantage came from the way its production was distributed.
The Texans rushed for 134 yards, averaged 4.2 yards per carry, avoided turnovers and generated more defensive disruption. C.J. Stroud avoided an interception, British Brooks and Woody Marks provided efficient rushing production, and Ka’imi Fairbairn converted all six field-goal attempts.
The biggest difference came late. Houston scored 12 fourth-quarter points while Indianapolis scored only three.
Ultimately, the texans vs colts match player stats demonstrate an important principle of football analysis: the team with more yards is not necessarily the team that controls the game. Houston combined efficiency, ball security, defensive pressure and scoring execution well enough to defeat an Indianapolis team that produced several outstanding individual performances.