New York Giants vs Chicago Bears Match Player Stats
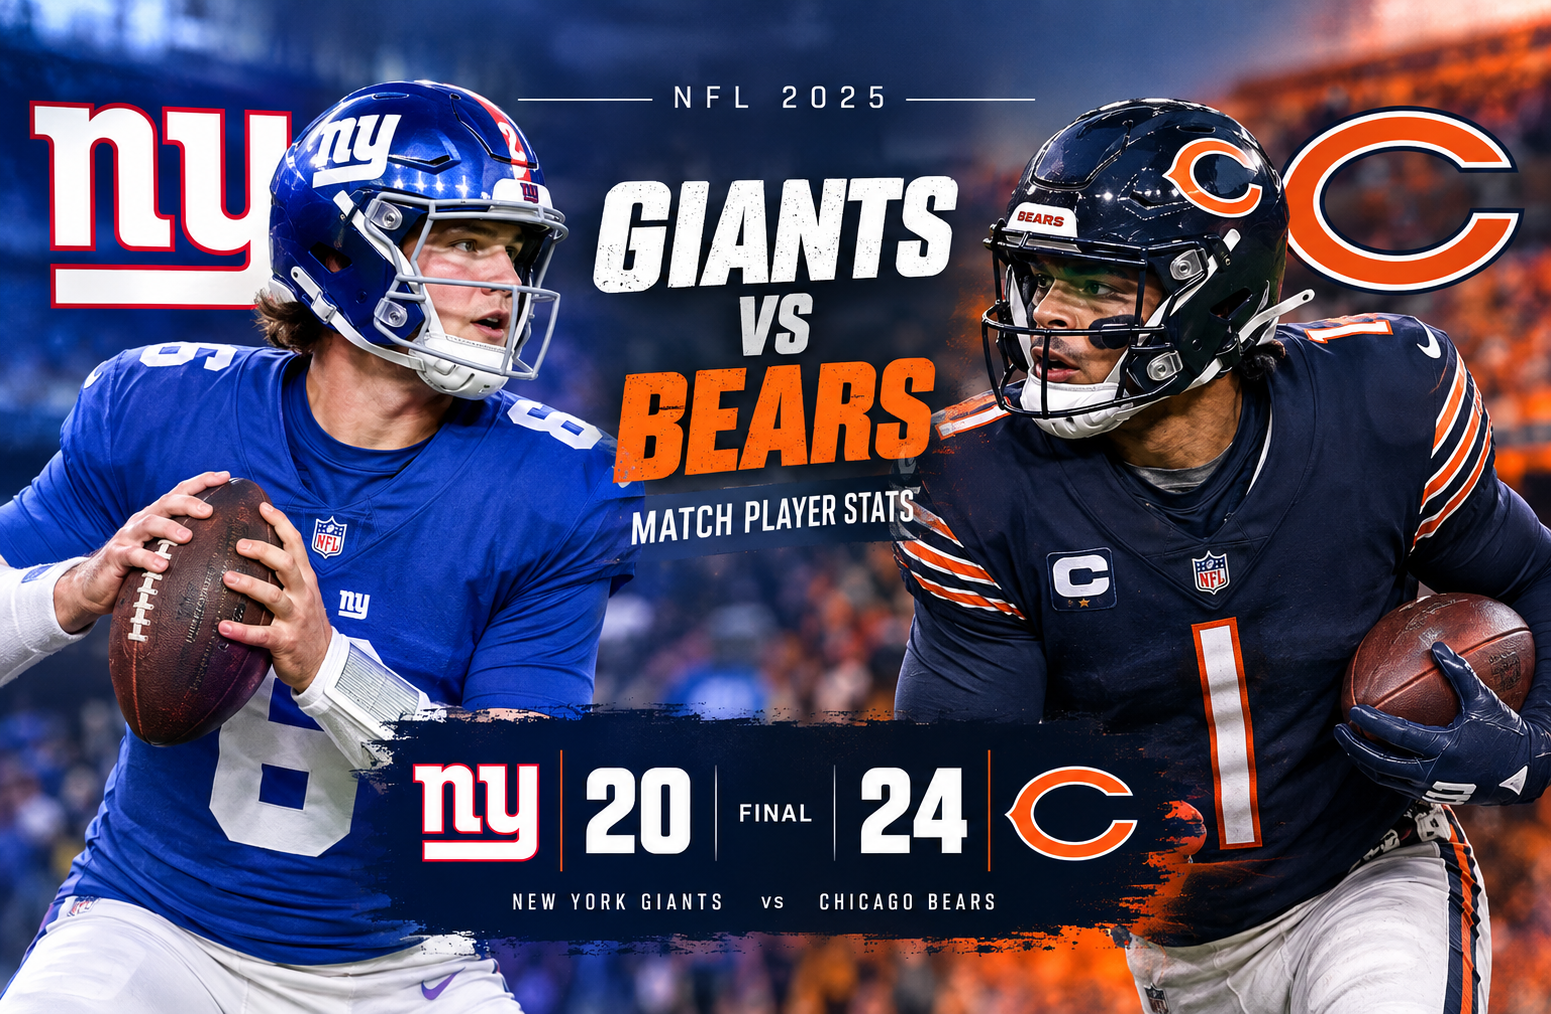
The new york giants vs chicago bears match player stats from November 9, 2025, tell the story of a game that looked under control for New York before Chicago completely changed the outcome in the fourth quarter. The Chicago Bears defeated the New York Giants 24-20 after trailing 20-10 with just over 10 minutes remaining. New York produced 391 total yards, including 262 passing yards and 169 rushing yards, while Chicago finished with 431 total yards, 220 through the air and 171 on the ground. The most important difference was not simply total yardage. Chicago converted its late opportunities, protected Caleb Williams from pressure, and scored 14 unanswered points in the final quarter. Game box score and detailed statistics
For anyone studying this matchup beyond the final score, the numbers reveal several important layers. Jaxson Dart moved the Giants’ offense effectively before leaving the game, Tyrone Tracy Jr. provided a strong rushing performance, and Darius Slayton created explosive receiving plays. On Chicago’s side, Caleb Williams combined efficient late-game quarterback play with dangerous rushing ability, while Rome Odunze delivered the receiving touchdown that started the comeback.
The final score was Chicago Bears 24, New York Giants 20, with Chicago improving to 6-3 and New York falling to 2-8. The Giants also remained winless on the road at 0-6, while Chicago improved to 3-1 at home.
Game Overview and Final Score
The matchup was a strong example of why football statistics need context. A basic box score might suggest that the teams were relatively close. Both teams produced more than 390 total yards, both rushed for more than 165 yards, and neither quarterback threw an interception.
Yet the game was decided by several smaller statistical advantages.
Chicago finished with:
- 431 total yards
- 220 passing yards
- 171 rushing yards
- 23 first downs
- 5-of-14 third-down conversions
- 3-of-4 red-zone efficiency
- Zero turnovers
- Zero sacks allowed
New York recorded:
- 391 total yards
- 262 passing yards
- 169 rushing yards
- 21 first downs
- 3-of-11 third-down conversions
- 1-of-4 red-zone efficiency
- One turnover
- Four sacks allowed
That red-zone difference is particularly important. The Giants moved the ball, but their scoring efficiency inside the opponent’s 20-yard line was poor. Chicago, meanwhile, converted three of four red-zone opportunities into touchdowns.
The game also demonstrated the importance of protecting the quarterback. New York allowed four sacks for 25 yards. Chicago did not allow a sack.
That combination of red-zone execution, quarterback protection, and late-game efficiency helped Chicago overcome New York’s 20-10 advantage in the fourth quarter.
New York Giants vs Chicago Bears Match Player Stats: Quarterbacks
Quarterback performance is one of the most useful places to begin when analyzing this matchup because both teams used different paths to create offense.
Jaxson Dart’s Passing Performance
Jaxson Dart completed 19 of 29 passes for 242 yards. He averaged 8.3 yards per attempt, did not throw a touchdown or interception, recorded a 73.6 QBR, and finished with a 91.5 passer rating.
His statistical profile was interesting because the Giants were able to create explosive passing plays without relying on a high touchdown total.
Dart’s key numbers were:
| Statistic | Jaxson Dart |
| Completions | 19 |
| Attempts | 29 |
| Completion rate | 65.5% |
| Passing yards | 242 |
| Yards per attempt | 8.3 |
| Touchdowns | 0 |
| Interceptions | 0 |
| Sacks | 2 |
| Sack yards | 12 |
| QBR | 73.6 |
| Passer rating | 91.5 |
A 65.5% completion rate combined with 8.3 yards per attempt indicates that Dart was not simply completing short, low-risk throws. He produced meaningful yardage on his completions.
The bigger problem was that the Giants did not turn that passing production into enough touchdowns.
Dart also contributed heavily as a runner, which made his overall offensive impact considerably larger than his passing line alone suggests.
Russell Wilson’s Role
Russell Wilson completed 3 of 7 attempts for 45 yards after entering the game. He averaged 6.4 yards per attempt and finished without a touchdown or interception.
His numbers were:
| Statistic | Russell Wilson |
| Completions | 3 |
| Attempts | 7 |
| Passing yards | 45 |
| Yards per attempt | 6.4 |
| Touchdowns | 0 |
| Interceptions | 0 |
| Sacks | 2 |
| Sack yards | 13 |
| QBR | 8.1 |
| Passer rating | 64.6 |
Wilson also added 12 rushing yards on two carries.
The most significant issue was the pressure he faced during the late stages. Two sacks cost the Giants 13 yards, and Chicago’s pressure helped prevent New York from sustaining the possession needed after the Bears took the lead.
Caleb Williams’ Passing Performance
Caleb Williams completed 20 of 36 passes for 220 yards and one touchdown. He averaged 6.1 yards per attempt and threw no interceptions.
His statistical line was:
| Statistic | Caleb Williams |
| Completions | 20 |
| Attempts | 36 |
| Completion rate | 55.6% |
| Passing yards | 220 |
| Yards per attempt | 6.1 |
| Touchdowns | 1 |
| Interceptions | 0 |
| Sacks | 0 |
| QBR | 73.5 |
| Passer rating | 83.1 |
At first glance, Williams’ passing statistics do not look spectacular. His completion percentage was lower than Dart’s and his yards per attempt were also lower.
But the complete quarterback picture is much more favorable.
Williams did not take a sack, did not throw an interception, added 63 rushing yards, scored a rushing touchdown, and led two fourth-quarter touchdown drives.
That is the difference between evaluating quarterback statistics as isolated numbers and evaluating them in game context.
The Fourth Quarter Changed Everything
The most important statistical sequence of the game occurred in the final quarter.
New York entered the fourth quarter with a 17-10 advantage. Younghoe Koo then kicked a 19-yard field goal with 10:19 remaining, pushing the Giants’ lead to 20-10.
From that point, Chicago scored 14 unanswered points.
Rome Odunze caught a two-yard touchdown pass from Williams with 3:56 remaining, reducing the deficit to 20-17.
Chicago then forced a New York punt.
Williams subsequently found Luther Burden III for a 27-yard gain, and two plays later he ran 17 yards for the go-ahead touchdown.
The sequence is important because it shows how quickly a close NFL game can turn when explosive plays appear late.
Chicago’s final two scoring drives included:
- A 91-yard touchdown drive
- A 53-yard touchdown drive
- A 27-yard completion to Luther Burden III
- A 17-yard rushing touchdown by Caleb Williams
New York had opportunities to respond but could not generate another scoring drive.
Tyrone Tracy Jr. Was One of New York’s Best Offensive Players
Tyrone Tracy Jr. produced one of the stronger individual rushing performances in the game.
He carried the ball 14 times for 71 yards, averaging 5.1 yards per carry. His longest run was 16 yards.
His rushing line:
| Statistic | Tyrone Tracy Jr. |
| Carries | 14 |
| Rushing yards | 71 |
| Average | 5.1 |
| Touchdowns | 0 |
| Long | 16 |
| Receptions | 1 |
| Receiving yards | 0 |
Tracy’s 71 rushing yards accounted for more than 40% of New York’s 169 rushing yards.
His contribution became especially visible during the fourth quarter when New York was trying to control the clock and protect its lead.
The Giants repeatedly used Tracy on the ground during their possession that eventually ended in a field goal. That drive moved deep into Chicago territory, but New York settled for three points rather than seven.
That was a critical missed opportunity.
Jaxson Dart as a Runner
Dart was also highly effective on the ground.
He rushed six times for 66 yards and scored two touchdowns. His 11.0 yards per carry was the highest average among New York players with multiple rushing attempts.
His two scoring runs were especially important because they gave the Giants a way to finish drives despite their inability to produce passing touchdowns.
Dart’s rushing statistics:
| Statistic | Jaxson Dart |
| Carries | 6 |
| Rushing yards | 66 |
| Average | 11.0 |
| Touchdowns | 2 |
| Long | 24 |
The combination of 242 passing yards and 66 rushing yards made Dart one of the most productive Giants offensive players before leaving the game.
Chicago’s Ground Game Was Slightly More Efficient
Chicago rushed for 171 yards on 28 attempts, averaging 6.1 yards per carry.
New York rushed for 169 yards on 30 attempts, averaging 5.6 yards per carry.
The overall difference was only two rushing yards, but Chicago gained more yardage per attempt.
D’Andre Swift
D’Andre Swift led Chicago in rushing.
He recorded:
- 13 carries
- 80 yards
- 6.2 yards per carry
- 25-yard long
Swift also caught five passes for 18 yards.
His receiving contribution was modest, but his rushing efficiency gave Chicago a reliable foundation.
Caleb Williams
Williams was arguably the most important rushing player in the game.
He ran eight times for 63 yards, averaging 7.9 yards per carry, with a long run of 29 yards.
He also scored the decisive 17-yard rushing touchdown.
That means Williams accounted for 63 rushing yards and one rushing touchdown in addition to his passing production.
His rushing ability created a major problem for New York because the Giants could not treat him as a stationary pocket passer.
Kyle Monangai
Kyle Monangai rushed seven times for 28 yards and scored one touchdown.
His average was 4.0 yards per carry, but his early touchdown gave Chicago its first lead of the afternoon.
The Bears’ rushing production was therefore spread across multiple players rather than relying exclusively on Swift.
New York’s Receiving Leaders
New York’s receivers produced 287 combined receiving yards according to the supplied game data.
Darius Slayton led the Giants with 89 receiving yards.
Darius Slayton
Slayton caught four passes on four targets for 89 yards.
He averaged 22.3 yards per reception and had a 38-yard long reception.
That is an explosive receiving profile.
His four catches accounted for a significant portion of New York’s passing production despite the fact that he was targeted only four times.
Theo Johnson
Theo Johnson caught seven passes for 75 yards on eight targets.
He averaged 10.7 yards per reception and recorded a 25-yard long.
His seven receptions were the most among Giants players.
Johnson provided a reliable intermediate option and helped keep the Giants’ passing attack moving.
Wan’Dale Robinson
Wan’Dale Robinson received the most targets among Giants receivers.
He finished with:
- 6 receptions
- 62 yards
- 10.3 yards per reception
- 11 targets
- 15-yard long
His 11 targets indicate how important he was to the Giants’ passing plan.
However, the difference between his target volume and Slayton’s explosive production shows the Giants used different types of receiving roles. Robinson was heavily involved in volume opportunities, while Slayton generated bigger chunks of yardage.
Devin Singletary’s Receiving Impact
Singletary caught three passes for 53 yards.
His 41-yard reception was the longest receiving play for New York.
Although he rushed for only 20 yards on eight carries, his contribution through the air added another explosive element to the offense.
Chicago’s Receiving Leaders
Chicago’s receiving production was led by Rome Odunze, who became particularly important in the fourth quarter.
Rome Odunze
Odunze caught six passes for 86 yards and one touchdown on 10 targets.
His average was 14.3 yards per reception, and his longest catch went for 27 yards.
Most importantly, he caught the two-yard touchdown pass that cut New York’s lead to 20-17.
That score changed the pressure level of the game.
Odunze had a relatively quiet statistical first half, but his late-game involvement was decisive.
Colston Loveland
Colston Loveland caught four passes for 55 yards.
He averaged 13.8 yards per reception and had a 20-yard long.
His production was especially valuable during Chicago’s fourth-quarter comeback because he contributed several important completions during the long touchdown drive.
Luther Burden III
Luther Burden III caught three passes for 51 yards.
He averaged 17.0 yards per reception.
His biggest play came late in the fourth quarter when Williams connected with him for 27 yards. That completion moved Chicago into a prime scoring position before Williams finished the drive with his rushing touchdown.
The play was a good example of explosive efficiency. Burden had only three receptions, but one of them materially changed the game.
New York Giants vs Chicago Bears Match Player Stats: Defense
Defense is where the matchup produced one of its clearest contrasts.
New York recorded:
- 64 tackles
- 32 solo tackles
- 0 sacks
- 2 tackles for loss
- 2 passes defended
- 3 quarterback hits
Chicago recorded:
- 68 tackles
- 39 solo tackles
- 4 sacks
- 7 tackles for loss
- 5 passes defended
- 9 quarterback hits
The Bears generated three times as many quarterback hits and twice as many tackles for loss.
Most importantly, Chicago recorded four sacks.
New York recorded none.
That pressure differential mattered because it reduced the Giants’ ability to maintain offensive rhythm late in the game.
Chicago also forced the only turnover of the matchup when Jaxson Dart lost a fumble.
The Turnover Battle Was Technically Close, But Not Equal
The teams combined for only one turnover.
New York lost one fumble.
Chicago lost none.
Neither quarterback threw an interception.
That means the turnover margin was Chicago +1.
In a four-point game, a single lost fumble can become extremely important.
Dart’s fumble also occurred during a significant moment in the second half. The Giants were attempting to maintain offensive momentum, and the play ultimately contributed to a disruption in their quarterback situation.
The statistical lesson is straightforward: a team does not need multiple turnovers to benefit from winning the turnover battle.
Red-Zone Efficiency Was the Hidden Decider
The most revealing statistic in this game may be red-zone efficiency.
New York went 1-for-4 in the red zone.
Chicago went 3-for-4.
That means Chicago scored touchdowns on 75% of its red-zone trips, while New York scored touchdowns on only 25%.
The Giants did score two rushing touchdowns through Dart, but they repeatedly had to settle for field goals or failed to finish drives.
Their fourth-quarter possession is the clearest example.
New York moved from its own territory all the way to the Chicago 1-yard line. The drive included significant rushing gains from Tracy and Singletary.
Yet the Giants failed to score a touchdown and settled for a field goal.
That produced a 20-10 lead instead of a potentially larger advantage.
Against a quarterback capable of creating explosive plays with his legs, leaving points on the field can be costly.
Third Down Tells Another Part of the Story
New York converted 3 of 11 third downs.
Chicago converted 5 of 14.
Chicago therefore had a better third-down conversion rate despite running fewer total plays.
The Bears also recorded 23 first downs compared with 21 for New York.
This is important because New York actually controlled several portions of the game through yardage production. The problem was sustaining that efficiency when the field became compressed.
Third-down performance often reveals whether an offense can consistently extend drives rather than simply produce isolated explosive plays.
Chicago was not dominant on third down, but it was better.
Total Yardage Was Not the Real Difference
New York gained 391 total yards.
Chicago gained 431.
That is a 40-yard difference.
Normally, that is meaningful, but the matchup shows why total yardage should not be treated as the final explanation for a result.
New York averaged 6.1 yards per play.
Chicago averaged 6.2.
The teams were therefore remarkably close in overall efficiency.
The bigger distinctions were:
- Chicago had four more first downs
- Chicago allowed zero sacks
- New York allowed four sacks
- Chicago won the turnover battle
- Chicago was much better in the red zone
- Chicago scored 14 unanswered points in the fourth quarter
Those details explain the final four-point margin much better than total yards alone.
Penalties Also Favored Chicago
New York committed 10 penalties for 69 yards.
Chicago committed three penalties for 25 yards.
That is a major difference.
New York’s penalty count was more than three times Chicago’s.
Penalties can be especially damaging when a team is already struggling to finish drives. A pre-snap mistake, offensive holding penalty, or pass interference call can erase positive field position and increase the distance required to convert.
Chicago’s cleaner game helped preserve its opportunities.
New York’s penalty total did not automatically cause the loss, but it contributed to a less efficient overall performance.
Time of Possession Was Surprisingly Close
New York held the ball for 31:18.
Chicago possessed it for 28:42.
The Giants therefore had the ball for approximately two and a half minutes longer.
That makes the outcome even more interesting.
New York did not lose because it never possessed the football.
It lost because Chicago made more of its opportunities.
This is one of the most useful lessons from the game for anyone studying football statistics. Possession, yardage, and completion percentage can describe how a game was played, but scoring efficiency explains why one team won.
Special Teams Statistics
Special teams did not dominate the outcome, but both kickers were perfect on field-goal attempts.
Younghoe Koo
Koo converted both of his field-goal attempts.
He also made both extra-point attempts and scored eight total points.
His field goals came from:
- 32 yards
- 19 yards
That made him responsible for a significant portion of New York’s scoring.
Cairo Santos
Santos made his only field-goal attempt from 22 yards.
He also converted all three extra points.
His total was six points.
Punting
Jamie Gillan punted three times for 110 yards, averaging 36.7 yards per punt.
Tory Taylor punted three times for 135 yards, averaging 45.0 yards.
Taylor also recorded two touchbacks.
The Bears therefore had the stronger average punting performance.
What the Player Statistics Really Tell Us
The surface-level conclusion is that Chicago won because Caleb Williams played well late.
That is true, but incomplete.
A deeper statistical reading shows that the Bears won through a combination of factors.
1. Chicago protected its quarterback
Williams was not sacked.
The Giants generated only three quarterback hits.
Meanwhile, New York quarterbacks were sacked four times.
2. Chicago finished drives
The Bears went 3-for-4 in the red zone.
New York went 1-for-4.
3. Williams created rushing value
His 63 rushing yards and decisive touchdown significantly increased his overall impact.
4. Chicago avoided turnovers
The Bears did not lose the ball.
New York lost one fumble.
5. Chicago produced explosive plays late
Burden’s 27-yard catch and Williams’ 29-yard scramble were particularly important.
6. New York’s offense moved the ball but did not finish
The Giants produced 391 total yards and 262 passing yards.
Those are respectable numbers.
The problem was turning production into touchdowns.
New York Giants vs Chicago Bears Match Player Stats: Biggest Takeaways
When evaluating the complete statistical picture, several players stand out.
New York Giants
Jaxson Dart: 242 passing yards, 66 rushing yards, two rushing touchdowns.
Tyrone Tracy Jr.: 71 rushing yards on 14 carries.
Darius Slayton: 89 receiving yards on four catches.
Theo Johnson: Seven receptions for 75 yards.
Wan’Dale Robinson: Six receptions on 11 targets.
Younghoe Koo: Eight points.
Chicago Bears
Caleb Williams: 220 passing yards, 63 rushing yards, two total touchdowns.
D’Andre Swift: 80 rushing yards.
Rome Odunze: Six catches, 86 yards, one touchdown.
Colston Loveland: Four catches, 55 yards.
Luther Burden III: Three catches, 51 yards.
Chicago defense: Four sacks, nine quarterback hits, seven tackles for loss.
Which Team Had the Better Offensive Performance?
This question requires some nuance.
New York generated more passing yards and almost the same rushing production as Chicago.
The Giants also averaged 6.1 yards per play compared with Chicago’s 6.2.
So from a pure yardage perspective, the offenses were close.
Chicago had the more effective offensive performance because it converted opportunities into points.
The Bears scored 24 points from 431 yards.
The Giants scored 20 points from 391 yards.
Chicago’s advantage becomes clearer when red-zone efficiency and turnovers are included.
The Bears were not dramatically more productive.
They were more efficient when the game mattered most.
Which Player Had the Biggest Overall Impact?
Caleb Williams is the strongest choice.
His passing line alone does not make him the obvious winner. A 20-of-36 performance for 220 yards and one passing touchdown is solid rather than spectacular.
His rushing numbers change the evaluation.
Williams added 63 rushing yards and scored the go-ahead touchdown with 1:47 remaining.
He also led the fourth-quarter comeback after Chicago fell behind 20-10.
That combination of passing, rushing, and late-game execution made him the central figure in the victory.
Why Jaxson Dart’s Performance Still Matters
Although Dart’s team lost, his statistical contribution should not be overlooked.
He completed 19 of 29 passes for 242 yards without an interception.
He also ran for 66 yards and two touchdowns.
That means he directly accounted for two Giants touchdowns and produced 308 combined passing and rushing yards.
His performance was especially notable because New York’s offense remained competitive throughout most of the game.
The issue was not that Dart produced nothing.
The issue was that the Giants could not maintain their advantage after taking a 20-10 lead.
The Most Important Statistical Lesson
The biggest lesson from this matchup is that efficiency beats accumulation.
The Giants accumulated:
- 391 yards
- 262 passing yards
- 169 rushing yards
- 31:18 possession
Yet they lost.
Chicago accumulated:
- 431 yards
- 220 passing yards
- 171 rushing yards
- 28:42 possession
Yet the Bears won.
The difference was what happened with those possessions.
Chicago converted more red-zone opportunities, avoided turnovers, allowed no sacks, and produced the decisive fourth-quarter plays.
That is why a serious analysis of football player statistics should always move beyond total yards.
Frequently Asked Questions
What was the final score of the Giants vs Bears game?
The Chicago Bears defeated the New York Giants 24-20 on November 9, 2025.
Who was the leading passer in the game?
Jaxson Dart led the game in passing yards with 242. He completed 19 of 29 passes without a touchdown or interception.
How did Caleb Williams perform against the Giants?
Caleb Williams completed 20 of 36 passes for 220 yards and one touchdown. He also rushed for 63 yards and scored the game-winning rushing touchdown.
Who led the Giants in rushing?
Tyrone Tracy Jr. led New York with 71 rushing yards on 14 carries. Jaxson Dart added 66 rushing yards and two rushing touchdowns.
Who led the Bears in receiving?
Rome Odunze led Chicago with six receptions for 86 yards and one touchdown.
Why did the Bears win despite the Giants having 262 passing yards?
Chicago was more efficient in key situations. The Bears went 3-for-4 in the red zone, avoided turnovers and sacks, and scored 14 unanswered points in the fourth quarter.
Conclusion
The new york giants vs chicago bears match player stats show a game that was far more competitive than the final four-point margin might suggest.
New York produced 391 total yards and received strong individual performances from Jaxson Dart, Tyrone Tracy Jr., Darius Slayton, Theo Johnson, and Wan’Dale Robinson. Dart’s combination of 242 passing yards, 66 rushing yards, and two rushing touchdowns gave the Giants enough offensive production to build a 20-10 fourth-quarter lead.
Chicago responded with a different type of performance.
Caleb Williams did not dominate through passing volume, but he remained turnover-free, avoided sacks, added 63 rushing yards, and delivered the decisive plays when the game reached its most important stage. Rome Odunze’s touchdown reduced the deficit, Luther Burden III produced a critical 27-yard reception, and Williams’ 17-yard touchdown run completed the comeback.
The broader team numbers reinforce that conclusion. Chicago held advantages in total yards, first downs, third-down efficiency, red-zone efficiency, sacks, quarterback hits, penalties, and turnovers. The Giants actually held a time-of-possession advantage and generated 262 passing yards, but those advantages were not enough to compensate for their 1-for-4 red-zone performance and four sacks allowed.
For statistical analysis, this matchup is a useful reminder that the most valuable numbers are not always the largest ones. Total yardage can show offensive capability, but red-zone efficiency, turnovers, quarterback pressure, explosive plays, and fourth-quarter execution often determine the result.
In this game, Chicago won that battle when it mattered most.