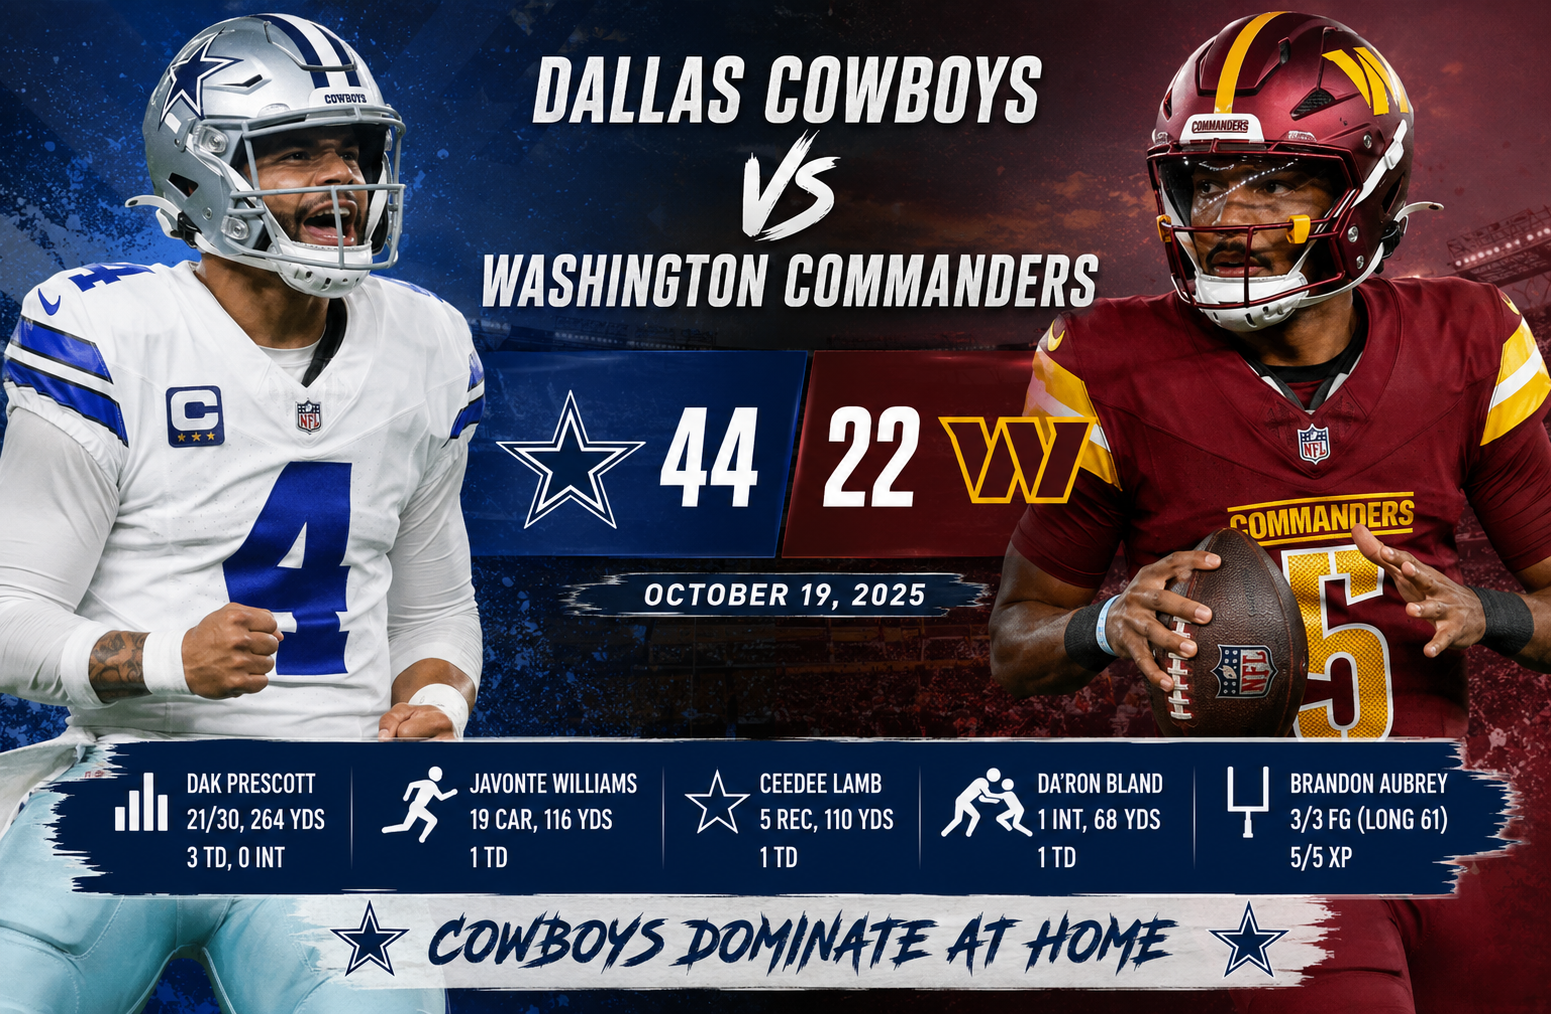
Dallas Cowboys vs Washington Commanders Match Player Stats
Dallas Cowboys vs Washington Commanders match player stats from October 19, 2025, tell the story of a game that was far more one-sided than the final score alone suggests. Dallas defeated Washington 44-22 at AT&T Stadium, producing 409 total yards, five touchdowns, three field goals, and a defensive touchdown. Washington managed 341 total yards, but its offense struggled to turn possessions into sustained scoring, while Dallas consistently created explosive plays and finished drives.
For anyone studying Dallas Cowboys vs Washington Commanders match player stats, the most important numbers are not simply the passing yards or touchdown totals. Dak Prescott’s efficiency, CeeDee Lamb’s explosive receiving performance, Javonte Williams’ rushing output, DaRon Bland’s 68-yard interception return, and Washington’s inability to protect the football all shaped the result.
The game also provides a useful example of why individual statistics should be read alongside team efficiency. Dallas averaged 6.6 yards per offensive play compared with Washington’s 5.3, converted 50% of its third downs, and finished with 21 first downs. Washington had 18 first downs but went 0-for-2 on fourth down.
Dallas Cowboys vs Washington Commanders Match Player Stats
The final score was Dallas 44, Washington 22. Dallas entered the game with a 3-3-1 record, while Washington fell to 3-4 after the loss. The Cowboys were 2-0-1 at home, while Washington moved to 1-3 on the road.
The scoring pattern explains why Washington could not keep pace.
| Quarter | Washington | Dallas |
| 1st | 8 | 17 |
| 2nd | 7 | 10 |
| 3rd | 7 | 14 |
| 4th | 0 | 3 |
| Final | 22 | 44 |
Dallas scored 17 points in the opening quarter and added another 10 before halftime. That early advantage forced Washington to play from behind for most of the afternoon.
The Cowboys eventually built a 41-22 advantage before Brandon Aubrey added a fourth-quarter field goal to complete the scoring. The official game summary records five Dallas touchdowns, including three passing touchdowns, one rushing touchdown, and one interception return.
Dak Prescott’s Passing Performance
Dak Prescott was the central figure in Dallas’ offensive production.
He completed 21 of 30 passes for 264 yards, threw three touchdowns, and did not throw an interception. He was sacked only once for seven yards. His official passer rating was 130.4.
Those numbers matter because Prescott did not need a huge number of attempts to control the game. His 70% completion rate combined with 8.8 yards per completion attempt created a highly efficient passing attack.
Dak Prescott passing stats
| Statistic | Dak Prescott |
| Completions | 21 |
| Attempts | 30 |
| Completion rate | 70.0% |
| Passing yards | 264 |
| Touchdowns | 3 |
| Interceptions | 0 |
| Sacks | 1 |
| Yards lost on sacks | 7 |
| Long completion | 74 yards |
| Passer rating | 130.4 |
The 74-yard completion was especially important because it demonstrates Dallas’ ability to generate chunk plays rather than relying exclusively on short throws.
Prescott also contributed five rushing attempts for seven yards. While his rushing production was modest, his mobility helped Dallas avoid making the quarterback position a weakness in the ground game.
The biggest contrast between the quarterbacks was turnover security. Prescott finished without an interception, while Washington’s quarterbacks combined for one interception and the Commanders also lost a fumble. That gave Dallas a much cleaner offensive profile.
Jayden Daniels’ Numbers Tell a More Complicated Story
Jayden Daniels completed 12 of 22 passes for 156 yards and one touchdown with no interceptions. He was sacked twice for five yards and finished with a 92.2 passer rating.
On the ground, Daniels added 35 yards on eight carries and scored one rushing touchdown.
| Statistic | Jayden Daniels |
| Completions | 12 |
| Attempts | 22 |
| Completion rate | 54.5% |
| Passing yards | 156 |
| Passing TDs | 1 |
| Interceptions | 0 |
| Sacks | 2 |
| Rushing attempts | 8 |
| Rushing yards | 35 |
| Rushing TDs | 1 |
| Passer rating | 92.2 |
At first glance, Daniels’ statistics do not look disastrous. He avoided an interception as a passer, contributed 35 rushing yards, and accounted for two touchdowns.
The problem was that Washington needed more efficiency from its passing game once Dallas created separation on the scoreboard.
Daniels’ 156 passing yards were 108 fewer than Prescott’s total. Washington’s offense also had to use Marcus Mariota, who completed four of 10 passes for 63 yards with one interception. Mariota was sacked twice for nine yards.
Together, Washington’s quarterbacks went 16-for-32 for 219 gross passing yards. After sacks, the team finished with 205 net passing yards.
Marcus Mariota’s Contribution
Mariota’s role became important because Washington needed additional quarterback snaps.
His final passing line was:
- 4 completions
- 10 attempts
- 63 yards
- 0 touchdowns
- 1 interception
- 2 sacks
- 22.1 passer rating
He did provide 34 rushing yards on two attempts, including a 25-yard run. That rushing efficiency was useful, but it could not offset the lost passing efficiency and interception.
The combination of Daniels and Mariota therefore produced a quarterback group that generated 205 net passing yards while Dallas produced 257 net passing yards.
Javonte Williams Was Dallas’ Leading Rusher
Javonte Williams delivered one of the clearest individual advantages of the game.
Williams carried the ball 19 times for 116 yards and one touchdown. He averaged 6.1 yards per carry and produced a 33-yard run.
| Statistic | Javonte Williams |
| Carries | 19 |
| Rushing yards | 116 |
| Average | 6.1 |
| Long run | 33 yards |
| Rushing TDs | 1 |
Williams accounted for more than three quarters of Dallas’ rushing yards by himself.
That workload also helped Dallas maintain offensive balance. Washington could not simply focus on Prescott because Dallas was gaining consistent yardage on the ground.
The Cowboys finished with 152 rushing yards on 31 attempts, averaging 4.9 yards per carry. Washington produced the same 4.9-yard average but accumulated 16 fewer rushing yards.
The distinction is important. Washington’s rushing attack was reasonably effective on a per-play basis, but Dallas combined a similar rushing average with superior passing efficiency and better scoring efficiency.
Washington’s Rushing Attack
Washington finished with 136 rushing yards on 28 attempts.
Jayden Daniels led the quarterback rushing production with 35 yards and one touchdown. Marcus Mariota added 34 yards, while Jacory Croskey-Merritt carried 13 times for 33 yards. Jeremy McNichols added 22 yards on two carries, and Chris Rodriguez Jr. finished with 12 yards and a touchdown on three attempts.
| Washington rusher | Carries | Yards | Average | TD |
| Jayden Daniels | 8 | 35 | 4.4 | 1 |
| Marcus Mariota | 2 | 34 | 17.0 | 0 |
| Jacory Croskey-Merritt | 13 | 33 | 2.5 | 0 |
| Jeremy McNichols | 2 | 22 | 11.0 | 0 |
| Chris Rodriguez Jr. | 3 | 12 | 4.0 | 1 |
| Team | 28 | 136 | 4.9 | 2 |
One interesting feature is the contrast between total rushing production and efficiency by player.
Mariota averaged 17.0 yards per carry, but he had only two attempts. Croskey-Merritt received the largest workload among Washington’s running backs but averaged only 2.5 yards per carry.
This is a good reminder that average yards per carry must be interpreted alongside volume.
CeeDee Lamb Delivered the Biggest Receiving Performance
CeeDee Lamb was Dallas’ leading receiver and one of the most important individual players in the game.
Lamb caught five passes for 110 yards and one touchdown. His average was 22.0 yards per reception, and his longest catch went for 74 yards. He was targeted eight times.
| Statistic | CeeDee Lamb |
| Targets | 8 |
| Receptions | 5 |
| Receiving yards | 110 |
| Average | 22.0 |
| Long reception | 74 |
| TDs | 1 |
The 74-yard reception had an outsized effect on the game because it immediately changed field position and created a major scoring opportunity.
Lamb did not need double-digit receptions to dominate the statistical impact of the passing game. His efficiency was the key.
Five catches on eight targets produced 110 yards, meaning Dallas was getting explosive value whenever Lamb connected with Prescott.
George Pickens Added Another Explosive Threat
George Pickens caught four passes for 82 yards on six targets.
His 20.5 yards per reception ranked just behind Lamb among Dallas’ primary receiving options. His longest catch was 44 yards.
That production made it harder for Washington’s defense to concentrate entirely on Lamb.
The Cowboys therefore had multiple receivers capable of creating large gains. This matters when analyzing the passing game because offensive success was not dependent on one player winning every matchup.
Jake Ferguson’s Two-Touchdown Performance
Jake Ferguson produced a different type of receiving impact.
He caught seven passes on seven targets for 29 yards and two touchdowns. His longest reception was 15 yards.
Ferguson’s average of 4.1 yards per reception was modest, but his two touchdowns demonstrate why raw receiving yardage does not always identify the most valuable receiver.
Dallas used Ferguson effectively in scoring situations.
His seven receptions also tied for the highest reception total by any player in the game. He was a major part of Dallas’ ability to finish drives.
This is one of the strongest examples from the game of why Dallas Cowboys vs Washington Commanders match player stats should be read beyond the yardage column.
Washington’s Leading Receivers
Washington spread its receiving production across several players.
Jaylin Lane led the Commanders with three receptions for 60 yards. Chris Moore caught two passes for 59 yards, while Zach Ertz recorded three receptions for 37 yards and one touchdown. Robbie Chosen added four receptions for 36 yards.
| Player | Targets | Receptions | Yards | TD |
| Jaylin Lane | 6 | 3 | 60 | 0 |
| Chris Moore | 5 | 2 | 59 | 0 |
| Zach Ertz | 7 | 3 | 37 | 1 |
| Robbie Chosen | 4 | 4 | 36 | 0 |
| Jeremy McNichols | 3 | 2 | 23 | 0 |
| John Bates | 2 | 1 | 5 | 0 |
| Jacory Croskey-Merritt | 2 | 1 | -1 | 0 |
| Luke McCaffrey | 2 | 0 | 0 | 0 |
Washington’s receiving corps actually produced some efficient individual plays. Chris Moore averaged 29.5 yards per reception, while Lane averaged 20.0.
The larger problem was volume and consistency. Washington completed only 16 passes, while Dallas completed 21.
Dallas Won the Efficiency Battle Through Explosive Plays
The official team statistics reveal a major difference in offensive efficiency.
Dallas generated 409 total yards from 62 offensive plays, averaging 6.6 yards per play. Washington produced 341 yards from 64 plays, averaging 5.3 yards per play.
That means Washington actually ran two more offensive plays, yet Dallas gained 68 more total yards.
This is a valuable analytical point.
The Cowboys were not simply winning because they had more possessions or significantly more plays. They were extracting more yardage from each opportunity.
Dallas also had:
- 21 first downs
- 11 passing first downs
- 7 rushing first downs
- 50% third-down conversion
- 409 total yards
- 152 rushing yards
- 257 net passing yards
Washington recorded:
- 18 first downs
- 8 passing first downs
- 8 rushing first downs
- 43.8% third-down conversion
- 341 total yards
- 136 rushing yards
- 205 net passing yards
Turnovers Changed the Shape of the Game
Turnovers were one of the clearest separators.
Washington lost one fumble and threw one interception as a team. Dallas committed one fumble but recovered it and did not throw an interception.
DaRon Bland made the biggest defensive play of the afternoon by intercepting Washington and returning the ball 68 yards for a touchdown.
That was not just a defensive statistic. It was a seven-point swing and an immediate scoring event.
Dallas finished with:
- 1 interception
- 68 interception-return yards
- 1 defensive touchdown
- 4 sacks
- 7 tackles for loss
- 6 quarterback hits
Washington finished with:
- 0 interceptions
- 1 fumble recovery
- 1 sack
- 3 tackles for loss
- 5 quarterback hits
The defensive numbers reinforce the offensive story. Dallas created more disruption and converted one of its biggest defensive opportunities directly into points.
DaRon Bland’s Defensive Touchdown
DaRon Bland’s interception return was arguably the game’s most valuable defensive play.
He recorded one interception and returned it 68 yards for a touchdown. Washington did not record an interception.
A defensive touchdown is especially valuable because it bypasses the normal offensive process. Dallas did not need to drive 60 or 70 yards to capitalize on the turnover.
That play also increased the pressure on Washington’s offense to respond quickly.
Dallas’ Leading Tacklers
Kenneth Murray Jr. and Shemar James each finished with nine total tackles.
Murray recorded six solo tackles, while James recorded four solo tackles.
Their production was important because Washington’s rushing attack was not completely ineffective. Dallas needed its defenders to limit extra yardage and finish plays.
The Cowboys’ defense recorded 67 total tackles, compared with Washington’s 70. That makes it clear that the victory was not simply about making more tackles.
The difference was what Dallas did with its defensive opportunities.
Bobby Wagner Led Washington in Tackles
Bobby Wagner led Washington with eight total tackles and three solo tackles.
Washington’s defense finished with 70 tackles, 33 solo tackles, one sack, three tackles for loss, seven passes defended, and five quarterback hits.
Those numbers show that the Commanders were active defensively, but activity did not translate into enough negative plays or turnovers.
Special Teams Also Favored Dallas in Important Moments
Special teams were not the headline of the game, but the numbers provide useful context.
Brandon Aubrey converted all three of his field-goal attempts, including a 61-yard field goal, and made all five extra points. He finished with 14 points.
Washington’s Matt Gay made both of his extra-point attempts.
Washington’s Luke McCaffrey was particularly productive on kickoff returns, recording eight returns for 209 yards and averaging 26.1 yards per return. His longest return went 41 yards.
KaVontae Turpin returned three kickoffs for Dallas for 80 yards, averaging 26.7 yards per return.
The contrast is interesting because Washington actually generated excellent kickoff-return production, yet Dallas still won comfortably.
That reinforces the central lesson from the game: one strong statistical category does not necessarily overcome weaknesses in scoring efficiency, turnovers, and explosive offensive plays.
Punting Comparison
Washington punter Tress Way punted five times for 286 yards, averaging 57.2 yards per punt with a long of 60 yards.
Dallas punter Bryan Anger punted three times for 128 yards, averaging 42.7 yards with a long of 49.
The difference in punt volume is notable.
Washington punted five times while Dallas punted three times. Dallas therefore sustained more drives and converted more of its possessions into scoring opportunities.
Red-Zone Efficiency Was a Major Difference
Both teams were capable of finishing when they reached the opponent’s red zone.
Washington went 3-for-3 in red-zone opportunities, a perfect 100% rate.
Dallas went 3-for-4, converting 75%.
At first glance, Washington’s 100% red-zone efficiency looks superior.
But the broader context matters. Dallas created more total scoring opportunities, generated a defensive touchdown, and made three field goals.
This is why red-zone percentage should not be isolated from the rest of the scoring profile.
Washington’s inability to create enough additional scoring opportunities became the larger problem.
Time of Possession and Offensive Control
Dallas held the ball for 31:21, while Washington had possession for 28:39.
The difference was only 2:42, so this was not a game where Dallas simply dominated possession.
Instead, Dallas made better use of its possessions.
The Cowboys had 62 offensive plays compared with Washington’s 64, yet Dallas gained 409 yards compared with Washington’s 341.
That is a particularly important finding for readers analyzing Dallas Cowboys vs Washington Commanders match player stats.
Dallas’ advantage came from quality per play rather than overwhelming volume.
Why the Final Score Became 44-22
The score can be explained through several connected factors.
1. Dallas generated more explosive passing plays
Prescott averaged strong production through the air, while Lamb and Pickens both produced receptions of 44 yards or more.
2. Javonte Williams controlled the ground game
Williams’ 116 yards on 19 carries gave Dallas a dependable rushing foundation.
3. Dallas protected the passing game better
Prescott was sacked once, while Washington’s quarterbacks were sacked four times.
4. Dallas created a defensive touchdown
Bland’s 68-yard interception return immediately produced seven points.
5. Washington lost a fumble
The Commanders finished with one lost fumble, adding another avoidable possession problem.
6. Dallas was more efficient per play
The Cowboys averaged 6.6 yards per offensive play compared with Washington’s 5.3.
Taken together, these factors explain the 22-point margin better than any single player statistic.
The Most Important Player Matchups
Several individual comparisons stand out.
Dak Prescott vs Jayden Daniels
Prescott had the clear statistical advantage as a passer.
He produced 264 yards, three touchdowns, and no interceptions on 30 attempts. Daniels produced 156 yards and one touchdown on 22 attempts, while also adding 35 rushing yards and a rushing touchdown.
Daniels contributed more as a runner, but Prescott’s passing efficiency was the bigger factor in the outcome.
CeeDee Lamb vs Washington’s secondary
Lamb’s 110 receiving yards and 74-yard touchdown reception made him Dallas’ biggest explosive receiving threat.
Washington’s defense recorded seven passes defended, but Dallas still produced 264 passing yards.
Javonte Williams vs Washington’s front
Williams averaged 6.1 yards per carry and finished with 116 yards.
Washington’s defense managed only one sack and three tackles for loss, limiting its ability to consistently disrupt Dallas’ offensive rhythm.
DaRon Bland vs Washington’s quarterbacks
Bland’s interception return touchdown was the single most direct defensive scoring play.
Washington’s quarterbacks combined for one interception, and that turnover became seven Dallas points.
What the Statistics Say About Washington
The Commanders were not completely outclassed in every category.
They produced 136 rushing yards and averaged 4.9 yards per carry.
They also recorded 18 first downs and converted 43.8% of third downs.
Their receiving group produced several explosive plays, including 59 yards from Chris Moore and 60 from Jaylin Lane.
The issue was consistency.
Washington needed to convert more of those individual gains into sustained drives and points.
The 22-point total reflects the problem. Even with 341 yards, the Commanders struggled to match Dallas‘ scoring efficiency.
The four sacks taken by Washington quarterbacks also reduced the value of its passing production.
What the Statistics Say About Dallas
Dallas’ statistical profile was much more balanced.
The Cowboys produced:
- 152 rushing yards
- 257 net passing yards
- 409 total yards
- 21 first downs
- 6.6 yards per play
- 4 sacks
- 1 interception
- 1 defensive touchdown
- 3 field goals
- 5 passing and rushing touchdowns combined through the offensive scoring game
The key is balance.
Prescott did not have to throw 40 or 45 times.
Williams did not need 25 or 30 carries.
Lamb did not need 10 receptions.
Dallas got strong contributions from multiple parts of the roster, which made its offense more difficult to contain.
A Deeper Statistical Reading
One of the biggest analytical mistakes in football is treating the box score as a collection of unrelated numbers.
This game demonstrates why relationships matter.
Dallas’ 264 gross passing yards were supported by 152 rushing yards. That prevented Washington from selling out against Prescott.
Prescott’s three touchdown passes were supported by Ferguson’s two touchdown receptions and Lamb’s explosive scoring play.
Williams’ 116 rushing yards helped keep Dallas ahead of the chains.
Meanwhile, Bland’s interception touchdown meant the Dallas defense directly contributed to the margin.
The result was a complementary performance.
Washington had useful individual statistics, but Dallas had more statistics that directly connected to points.
A Practical Way to Analyze Similar NFL Box Scores
If you are studying player statistics for fantasy football, betting analysis, historical research, or team evaluation, it is useful to follow a consistent process.
Step 1: Start with team totals
Look at total yards, plays, first downs, third-down efficiency, and turnovers.
Step 2: Compare quarterback efficiency
Do not focus only on passing yards. Check completion percentage, touchdowns, interceptions, sacks, and passer rating.
Step 3: Evaluate rushing volume and efficiency
A running back with 100 yards on 25 carries has a different performance profile from one with 100 yards on 15 carries.
Step 4: Identify explosive plays
Long receptions, long runs, and defensive returns can change a game without appearing frequently in the box score.
Step 5: Check turnovers
Turnovers often explain scoring differences that raw yardage cannot.
Step 6: Examine scoring opportunities
Red-zone performance, field goals, and defensive touchdowns can reveal how efficiently teams converted production into points.
This approach provides a much more reliable interpretation than simply identifying the player with the most yards.
Where to Verify the Official Game Data
For readers who want to cross-check the figures, the official NFL game statistics provide the complete team and individual box score, including passing, rushing, receiving, defensive, kicking, punting, and return statistics.
FAQs
Who won the Cowboys vs Commanders game on October 19, 2025?
The Dallas Cowboys defeated the Washington Commanders 44-22 at AT&T Stadium.
How many passing yards did Dak Prescott have?
Dak Prescott completed 21 of 30 passes for 264 yards, three touchdowns, and no interceptions.
How many rushing yards did Javonte Williams have?
Javonte Williams rushed 19 times for 116 yards and one touchdown, averaging 6.1 yards per carry.
How many receiving yards did CeeDee Lamb record?
CeeDee Lamb caught five passes for 110 yards and one touchdown. His longest reception was 74 yards.
How did Jayden Daniels perform?
Jayden Daniels completed 12 of 22 passes for 156 yards and one touchdown without an interception. He also rushed eight times for 35 yards and one touchdown.
Who scored the defensive touchdown for Dallas?
DaRon Bland intercepted a Washington pass and returned it 68 yards for a touchdown.
Conclusion
The Dallas Cowboys vs Washington Commanders match player stats show that Dallas won through a combination of quarterback efficiency, explosive receiving, productive rushing, defensive playmaking, and better overall yards-per-play efficiency.
Dak Prescott’s 264 passing yards and three touchdowns gave Dallas the passing advantage. CeeDee Lamb added 110 receiving yards and a touchdown, while George Pickens contributed 82 yards. Javonte Williams provided 116 rushing yards and one touchdown, giving the Cowboys a balanced offensive attack.
Washington had productive individual performances of its own. Jayden Daniels accounted for 191 combined passing and rushing yards and two touchdowns. Jaylin Lane and Chris Moore created explosive receiving plays, while Luke McCaffrey delivered 209 kickoff-return yards.
However, the wider statistical picture favored Dallas. The Cowboys produced 409 total yards to Washington’s 341, averaged 6.6 yards per play compared with 5.3, recorded four sacks to Washington’s one, and converted DaRon Bland’s interception into a 68-yard defensive touchdown.
The most useful lesson from this box score is that player statistics become much more meaningful when connected to efficiency, field position, turnovers, and scoring. Dallas did not dominate every individual category, but its best performances came in the areas that most directly affected the final result.