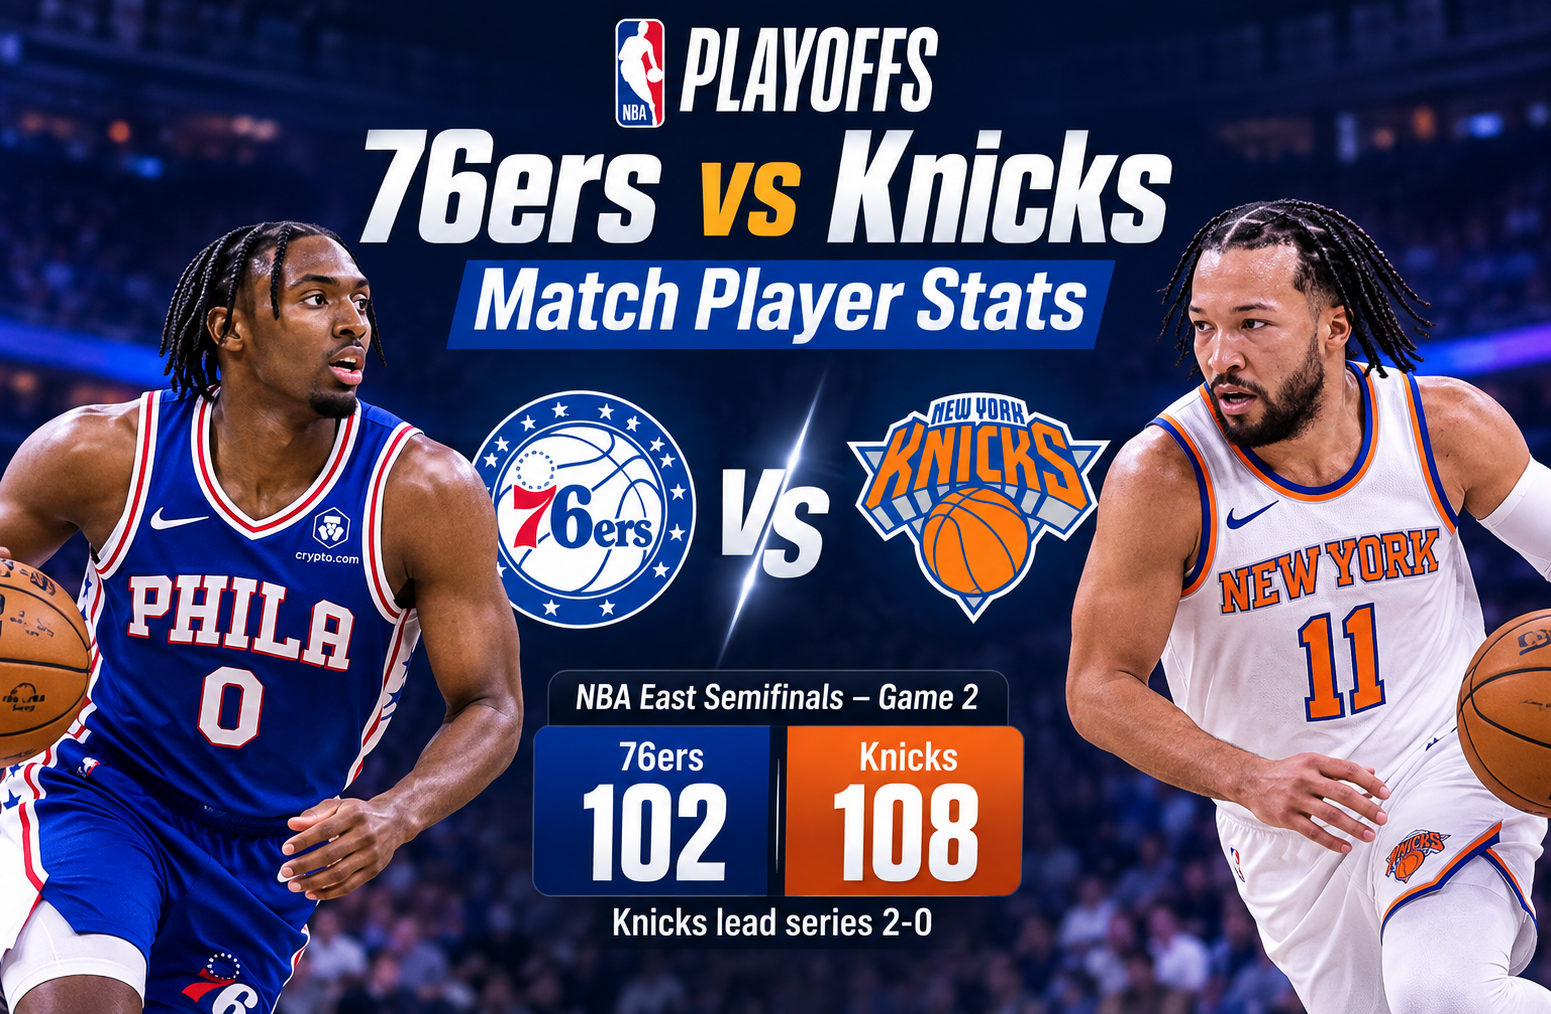
76ers vs knicks match player stats
The 76ers vs knicks match player stats from Game 2 of the 2026 Eastern Conference semifinals tell the story of a tightly contested game that New York ultimately won 108-102. The Knicks led the series 2-0 after holding Philadelphia to just 12 fourth-quarter points. Jalen Brunson and Tyrese Maxey both scored 26 points, while OG Anunoby added 24 for New York and Paul George and Kelly Oubre Jr. each scored 19 for Philadelphia.
The game was played at Madison Square Garden and featured a dramatic fourth quarter after three periods that were almost perfectly balanced. Philadelphia entered the final period leading 90-89, but New York outscored the 76ers 19-12 to complete the comeback. The official NBA game record lists the contest as Game 2 on May 6, 2026, despite some listings referring to May 7 because of publication timing. (NBA.com)
76ers vs knicks match player stats
The most useful way to understand this matchup is to look beyond the final score. Philadelphia actually shot better from three-point range, making 13 of 34 attempts for 38.2 percent, compared with New York’s 7 of 26 for 26.9 percent. The Knicks won because they were more efficient overall from the field, protected the ball better and converted a greater percentage of their free throws.
| Team | Points | FG | 3PT | FT | Rebounds | Assists | Turnovers |
| Philadelphia 76ers | 102 | 34-75 | 13-34 | 21-28 | 39 | 20 | 18 |
| New York Knicks | 108 | 40-79 | 7-26 | 21-25 | 37 | 25 | 13 |
New York’s five-point advantage in field goals made was especially important. The Knicks converted 50.6 percent of their shots from the field, while Philadelphia finished at 45.3 percent.
That difference helped offset Philadelphia’s superior three-point shooting.
The other major statistical gap was turnovers. Philadelphia committed 18 turnovers compared with 13 for New York. In a six-point game, those five extra possessions mattered.
NBA’s official game summary also records 25 lead changes and 14 ties, highlighting just how competitive the contest was before New York separated itself late. (NBA.com)
Game summary and final score
The Knicks defeated the 76ers 108-102 at Madison Square Garden.
Philadelphia’s quarter-by-quarter scoring was:
- First quarter: 33
- Second quarter: 29
- Third quarter: 28
- Fourth quarter: 12
New York’s scoring was:
- First quarter: 31
- Second quarter: 30
- Third quarter: 28
- Fourth quarter: 19
The first three quarters produced a remarkably close game. Philadelphia scored 33 points in the opening period and took a narrow 33-31 lead. New York answered in the second quarter, but the 61-62 halftime score still left the game essentially even.
The third quarter produced another 28 points for each team.
That left the entire game in the hands of the fourth quarter.
Philadelphia could not maintain its offensive rhythm when the pressure increased. New York’s defense forced difficult possessions, while Brunson became increasingly influential as the clock moved toward the final minutes.
According to the NBA’s official recap, New York eventually used a late 9-0 run to create the separation it needed. (NBA.com)
Philadelphia 76ers player stats
Philadelphia received strong scoring contributions from several players, but the team’s offensive production declined sharply in the final period.
Tyrese Maxey
Tyrese Maxey was Philadelphia’s leading scorer with 26 points.
| Statistic | Maxey |
| Minutes | 47 |
| Points | 26 |
| FG | 9-23 |
| 3PT | 1-6 |
| FT | 7-9 |
| Rebounds | 3 |
| Assists | 6 |
| Turnovers | 6 |
| Steals | 1 |
| Plus/Minus | 0 |
Maxey’s 26 points came on 9-of-23 shooting. He also contributed six assists, but his six turnovers were one of the most significant negative statistics for Philadelphia.
Playing 47 minutes also shows how heavily the 76ers depended on him. He was asked to create offense for much of the game, particularly when Philadelphia needed a reliable ball handler late.
His three-point shooting was not as effective as his overall scoring. Maxey made only one of six attempts from outside the arc.
That became important because Philadelphia needed every available source of efficient offense in the fourth quarter.
Paul George
Paul George produced 19 points in 43 minutes.
| Statistic | George |
| Minutes | 43 |
| Points | 19 |
| FG | 7-18 |
| 3PT | 5-13 |
| FT | 0-1 |
| Rebounds | 6 |
| Assists | 4 |
| Steals | 2 |
| Blocks | 2 |
| Turnovers | 2 |
| Plus/Minus | -4 |
George was one of Philadelphia’s most important perimeter shooters. His five made three-pointers were tied for the team’s highest individual total.
He also contributed six rebounds, four assists, two steals and two blocks, giving him a broad statistical impact beyond scoring.
However, he went 0-for-1 at the free-throw line and shot 7-for-18 overall.
The most notable part of his performance was his two-way contribution. A player recording 19 points, six rebounds, four assists, two steals and two blocks is contributing in several areas even when the shooting efficiency is not perfect.
Kelly Oubre Jr.
Kelly Oubre Jr. also scored 19 points.
| Statistic | Oubre Jr. |
| Minutes | 40 |
| Points | 19 |
| FG | 6-12 |
| 3PT | 3-6 |
| FT | 4-4 |
| Rebounds | 5 |
| Assists | 2 |
| Steals | 1 |
| Turnovers | 1 |
| Plus/Minus | -8 |
Oubre was one of Philadelphia’s most efficient scorers.
He shot 50 percent from the field, 50 percent from three-point range and a perfect 4-for-4 at the free-throw line.
His offensive efficiency was useful because Philadelphia needed players capable of scoring without requiring a large number of possessions.
However, his team-worst minus-8 among Philadelphia’s principal scorers shows that individual scoring efficiency did not fully translate into winning minutes.
VJ Edgecombe
VJ Edgecombe scored 17 points in 40 minutes.
He finished 6-of-13 from the field and 3-of-7 from three-point range.
Edgecombe also recorded five rebounds and three assists.
His three made three-pointers helped Philadelphia maintain its perimeter threat, especially during the middle stages of the game.
However, four turnovers reduced some of the value of his offensive contribution.
Andre Drummond
Andre Drummond played 15 minutes and produced six points and eight rebounds.
He was extremely efficient from the field, making both of his shot attempts and both free throws.
His eight rebounds included two offensive boards.
For a player with only 15 minutes, eight rebounds represented a meaningful contribution to Philadelphia’s work on the glass.
Adem Bona
Adem Bona provided an interesting defensive and rebounding contribution.
He scored only two points but collected seven rebounds and blocked two shots in 16 minutes.
More importantly, six of his seven rebounds came on the offensive end.
That is an important detail because offensive rebounds can generate additional possessions even when a player is not scoring consistently.
Dominick Barlow
Dominick Barlow scored six points in 16 minutes.
He was perfect from the field, going 3-for-3, while also recording two rebounds and two blocks.
His two blocks were tied for Philadelphia’s individual high in the game.
Quentin Grimes
Quentin Grimes played 24 minutes and scored seven points.
He made one of four field-goal attempts and one of two three-point attempts while converting all four of his free throws.
He also contributed three rebounds, three assists and one steal.
New York Knicks player stats
New York’s production was led by three major scorers, with Brunson, Anunoby and Karl-Anthony Towns combining for 70 points.
The official NBA recap specifically highlighted the Knicks’ ability to survive despite poor three-point shooting and a difficult game. (NBA.com)
Jalen Brunson
Jalen Brunson led New York with 26 points.
| Statistic | Brunson |
| Minutes | 41 |
| Points | 26 |
| FG | 9-21 |
| 3PT | 1-5 |
| FT | 7-8 |
| Rebounds | 1 |
| Assists | 6 |
| Steals | 1 |
| Turnovers | 3 |
| Plus/Minus | +7 |
Brunson’s performance was especially important because his strongest work came when the game was being decided.
He shot 9-of-21 from the field and 1-of-5 from three-point range, so this was not a game where he dominated through shooting efficiency alone.
Instead, his value increased in the fourth quarter.
NBA’s official recap noted that Brunson hit the go-ahead basket with 5:06 remaining and later added another jumper to give New York a 103-99 advantage. (NBA.com)
That is the clearest example of why raw shooting percentages cannot always explain playoff performances.
A player can have an imperfect shooting night while still making the possessions that matter most.
OG Anunoby
OG Anunoby scored 24 points and was one of New York’s most complete performers.
| Statistic | Anunoby |
| Minutes | 37 |
| Points | 24 |
| FG | 9-17 |
| 3PT | 2-7 |
| FT | 4-4 |
| Rebounds | 5 |
| Assists | 2 |
| Steals | 4 |
| Blocks | 1 |
| Turnovers | 0 |
| Plus/Minus | +12 |
Anunoby shot 9-of-17 from the field and added four steals and one block.
The most striking statistic is his zero turnovers.
He combined high scoring volume with ball security and defensive activity.
His plus-12 was also the best mark among the players listed in the supplied statistics.
That combination makes Anunoby arguably one of the most complete statistical performers of the game, even though Brunson received much of the attention because of his fourth-quarter scoring.
Karl-Anthony Towns
Karl-Anthony Towns delivered one of the most versatile performances of the game.
| Statistic | Towns |
| Minutes | 27 |
| Points | 20 |
| FG | 6-8 |
| 3PT | 1-1 |
| FT | 7-9 |
| Rebounds | 10 |
| Assists | 7 |
| Steals | 1 |
| Turnovers | 3 |
| Plus/Minus | +6 |
Towns scored 20 points while shooting 6-of-8 from the field.
He also collected 10 rebounds and seven assists.
That is almost a triple-double, and it demonstrates how much offensive responsibility he handled despite playing only 27 minutes.
His minutes were limited by foul trouble, which makes the production even more notable.
Towns’ seven assists were the highest total on either team.
He was not simply functioning as a scorer or rebounder. He was also helping New York move the ball and create opportunities for teammates.
Mikal Bridges
Mikal Bridges scored 18 points on an excellent 9-of-13 shooting performance.
| Statistic | Bridges |
| Minutes | 38 |
| Points | 18 |
| FG | 9-13 |
| 3PT | 0-2 |
| Rebounds | 5 |
| Assists | 2 |
| Steals | 1 |
| Blocks | 1 |
| Turnovers | 0 |
| Plus/Minus | +7 |
Bridges did not make a three-pointer, but that did not prevent him from being highly efficient.
His 9-of-13 field-goal shooting produced an efficient scoring night, while he also recorded one steal, one block and five rebounds.
The zero turnovers are again significant.
New York had several players combining efficient scoring with relatively controlled possession management.
Josh Hart
Josh Hart scored only five points, but his overall statistical line was much more useful than the scoring number suggests.
He finished with:
- 5 points
- 7 rebounds
- 6 assists
- 3 steals
- 4 turnovers
- 44 minutes
Hart’s offensive efficiency was not strong, but his rebounding, passing and defensive activity helped New York compete throughout the game.
His 44 minutes were also the second-highest workload on the Knicks.
Jordan Clarkson
Jordan Clarkson scored six points in eight minutes.
He shot 2-of-4 from the field and 2-of-2 from the free-throw line.
He also collected five rebounds, including three offensive rebounds.
That rebounding production was particularly impressive considering his limited playing time.
Miles McBride
Miles McBride played 21 minutes and scored four points.
He made one of five field-goal attempts and one of four three-point attempts.
He also contributed one rebound, one assist and one turnover.
His offensive numbers were modest, but he provided additional backcourt minutes in a game where New York’s primary creators carried substantial workloads.
Team shooting comparison
One of the most interesting aspects of the game was the difference between overall field-goal shooting and three-point shooting.
Philadelphia:
- 34-of-75 from the field
- 45 percent field-goal shooting
- 13-of-34 from three
- 38 percent three-point shooting
- 21-of-28 from the line
- 75 percent free-throw shooting
New York:
- 40-of-79 from the field
- 51 percent field-goal shooting
- 7-of-26 from three
- 27 percent three-point shooting
- 21-of-25 from the line
- 84 percent free-throw shooting
At first glance, Philadelphia’s three-point advantage might suggest that the 76ers should have won.
But basketball scoring efficiency is broader than three-point percentage.
New York made six more field goals overall.
The Knicks also made four more field goals inside the three-point line, while their five fewer turnovers helped them generate more usable possessions.
The free-throw difference also mattered. Both teams made 21 free throws, but New York needed only 25 attempts compared with Philadelphia’s 28.
Rebounding battle
Philadelphia finished with 39 total rebounds, while New York recorded 37.
That means rebounding did not determine the outcome.
Philadelphia had 11 offensive rebounds compared with nine for New York.
Adem Bona was particularly important in this area with six offensive rebounds.
The 76ers therefore created extra possessions on the offensive glass, but they did not convert that advantage into enough fourth-quarter scoring.
This is an important lesson when analyzing box scores.
A team can win a statistical category and still lose because another category has a greater effect on the final result.
Assists and ball movement
New York recorded 25 assists compared with Philadelphia’s 20.
Karl-Anthony Towns led the Knicks with seven assists, while Jalen Brunson and Josh Hart each added six.
Philadelphia’s Tyrese Maxey led the team with six assists.
The five-assist difference reflects a broader offensive distinction.
New York had several players capable of creating or facilitating offense.
Towns could pass from the frontcourt. Brunson could create from the perimeter. Hart could contribute as a secondary playmaker.
Philadelphia had strong individual scoring, but the offense became less effective when New York applied pressure late.
Turnovers were a major difference
Philadelphia committed 18 turnovers.
New York committed 13.
That five-turnover gap is significant in a game decided by six points.
Philadelphia’s leading scorer, Maxey, accounted for six turnovers by himself.
That does not mean every turnover was equally damaging, but the overall number illustrates how difficult it was for Philadelphia to maintain clean possessions.
New York also recorded 10 steals compared with eight for Philadelphia.
The Knicks therefore generated more defensive disruptions while committing fewer turnovers themselves.
That combination gave them an important possession advantage.
The fourth quarter changed everything
The fourth quarter is arguably the most important part of the entire game.
Philadelphia scored only 12 points.
New York scored 19.
After three quarters, Philadelphia had 90 points and New York had 89.
So the 108-102 final score was almost entirely determined by New York’s seven-point fourth-quarter advantage.
This is why simply looking at the final shooting percentages can miss the central story.
Philadelphia shot 45 percent overall and 38 percent from three.
Those are respectable numbers.
But the 76ers could not sustain their offense when the game entered its decisive stretch.
NBA’s official reporting described the late New York run as the turning point, while Reuters reported that Philadelphia went cold after holding a 99-96 lead with 6:52 remaining. (NBA.com)
Why Jalen Brunson’s 26 points mattered
Brunson and Maxey both finished with 26 points.
On a basic box-score comparison, their scoring output was identical.
The difference came from timing and possession control.
Brunson shot 9-of-21, while Maxey shot 9-of-23.
Brunson also had three turnovers compared with Maxey’s six.
Most importantly, Brunson produced several of his biggest plays late.
This is a useful distinction when evaluating playoff performances.
Twenty-six points accumulated evenly across four quarters are valuable. Twenty-six points with crucial baskets during the final possessions can have an even greater practical impact.
Brunson’s late-game shot-making helped New York turn a one-possession game into a six-point victory.
Why OG Anunoby deserves special attention
Brunson was the headline scorer, but Anunoby’s complete statistical profile should not be overlooked.
He produced:
- 24 points
- 5 rebounds
- 2 assists
- 4 steals
- 1 block
- 0 turnovers
- +12 plus/minus
The zero turnovers stand out.
So does the combination of 24 points and five defensive events in the steals and blocks categories.
Anunoby gave New York scoring without sacrificing defensive activity.
His plus-12 was the strongest plus/minus among the supplied player statistics.
That makes his performance one of the clearest examples of two-way impact in the matchup.
Karl-Anthony Towns nearly produced a triple-double
Towns finished with 20 points, 10 rebounds and seven assists.
The 10 rebounds gave him the game’s highest individual rebounding total.
His seven assists were also the highest individual total.
That means Towns led New York in two major non-scoring categories while scoring 20 points himself.
The challenge was that foul trouble limited him to 27 minutes.
Even with restricted playing time, he remained highly efficient, going 6-of-8 from the field and 1-of-1 from three-point range.
His performance was therefore much more significant than his 20-point total alone suggests.
What the plus/minus numbers tell us
Plus/minus should never be treated as a complete measure of individual performance, but it can provide useful context.
New York’s leading figures included:
- OG Anunoby: +12
- Mikal Bridges: +7
- Jalen Brunson: +7
- Karl-Anthony Towns: +6
- Josh Hart: +5
Philadelphia’s primary players were generally negative or around even:
- Tyrese Maxey: 0
- Paul George: -4
- Kelly Oubre Jr.: -8
- VJ Edgecombe: -5
Maxey’s zero is particularly interesting.
Philadelphia lost the game, but his minutes were not associated with a negative plus/minus.
That reinforces why plus/minus should be considered alongside points, shooting, turnovers, assists and defensive production rather than used independently.
Bench production and rotation impact
The game was heavily influenced by the workloads of the main players.
Maxey played 47 minutes.
Paul George played nearly 43 minutes.
Josh Hart played 44 minutes.
Brunson played 41 minutes.
Oubre played nearly 40 minutes.
Edgecombe played 40 minutes.
These numbers show how much both teams relied on their primary rotation players.
Philadelphia’s bench had some productive moments, especially from Drummond and Barlow, but the team’s main offensive burden remained on Maxey, George, Oubre and Edgecombe.
New York had a similar reliance on its primary group.
The difference was that the Knicks received strong contributions from several players across scoring, passing and defense.
What the numbers say about Philadelphia
Philadelphia’s performance was considerably better than the final result might suggest.
The 76ers:
- Shot better from three
- Collected more rebounds
- Made 13 three-pointers
- Had multiple players in double figures
- Held a one-point lead entering the fourth quarter
Yet they still lost by six.
The biggest weaknesses were turnovers and fourth-quarter offense.
Eighteen turnovers created unnecessary pressure.
The 12-point fourth quarter was even more damaging.
The statistical lesson is straightforward: Philadelphia did enough in many areas to remain competitive, but it did not execute well enough during the game’s most important stretch.
What the numbers say about New York
New York did not win because of spectacular three-point shooting.
The Knicks won through a broader combination of factors.
They:
- Shot 51 percent from the field
- Made 40 field goals
- Committed only 13 turnovers
- Recorded 25 assists
- Shot 84 percent from the free-throw line
- Held Philadelphia to 12 fourth-quarter points
- Received 70 combined points from Brunson, Towns and Anunoby
That is a more balanced winning profile.
New York also showed the ability to win a close game despite struggling from three-point range.
That matters in playoff basketball because postseason games often become slower, more physical and more dependent on half-court execution.
Biggest statistical takeaways
The most important numbers from the game can be summarized quickly.
1. Both teams had a 26-point leading scorer
Jalen Brunson and Tyrese Maxey both scored 26.
2. OG Anunoby had the best plus/minus
Anunoby finished at +12.
3. Towns controlled the glass
Towns collected 10 rebounds.
4. Towns also led in assists
His seven assists were the most in the game.
5. Philadelphia shot better from three
The 76ers made 38 percent of their three-point attempts compared with 27 percent for New York.
6. New York shot better overall
The Knicks made 51 percent of their field-goal attempts compared with 45 percent for Philadelphia.
7. Philadelphia committed more turnovers
The 76ers had 18 turnovers compared with 13 for New York.
8. The fourth quarter decided the game
Philadelphia scored 12 fourth-quarter points, while New York scored 19.
How to read these stats correctly
A good player-stat analysis should not simply list points.
Points tell you who scored.
They do not always tell you who influenced the game most.
For this matchup, a deeper reading should include:
Scoring efficiency:
Look at field goals, three-pointers and free throws together.
Playmaking:
Assists show creation, but turnovers provide the necessary context.
Rebounding:
Offensive rebounds can create additional possessions, while defensive rebounds end possessions.
Defensive activity:
Steals and blocks offer visible evidence, although they do not capture every defensive contribution.
Plus/minus:
This can provide useful lineup context but should not be interpreted as an isolated measure of individual quality.
Game situation:
Fourth-quarter production can explain why two players with identical scoring totals had very different impacts on the result.
This approach gives readers a much clearer understanding of what actually happened.
76ers vs Knicks match player stats: key player comparison
| Player | Team | PTS | REB | AST | FG | 3PT | TO | +/- |
| Tyrese Maxey | 76ers | 26 | 3 | 6 | 9-23 | 1-6 | 6 | 0 |
| Paul George | 76ers | 19 | 6 | 4 | 7-18 | 5-13 | 2 | -4 |
| Kelly Oubre Jr. | 76ers | 19 | 5 | 2 | 6-12 | 3-6 | 1 | -8 |
| VJ Edgecombe | 76ers | 17 | 5 | 3 | 6-13 | 3-7 | 4 | -5 |
| Jalen Brunson | Knicks | 26 | 1 | 6 | 9-21 | 1-5 | 3 | +7 |
| OG Anunoby | Knicks | 24 | 5 | 2 | 9-17 | 2-7 | 0 | +12 |
| Karl-Anthony Towns | Knicks | 20 | 10 | 7 | 6-8 | 1-1 | 3 | +6 |
| Mikal Bridges | Knicks | 18 | 5 | 2 | 9-13 | 0-2 | 0 | +7 |
This table shows why the final result cannot be explained by scoring alone.
Maxey and Brunson both scored 26.
However, Brunson’s team won, while Maxey’s team lost.
Anunoby scored fewer points than both Brunson and Maxey, yet his +12 plus/minus was the highest among the players listed.
Towns scored 20 but nearly produced a triple-double.
Bridges scored 18 while shooting 9-of-13 from the field and committing no turnovers.
Each player influenced the game differently.
Match statistics at a glance
| Category | 76ers | Knicks | Advantage |
| Final Score | 102 | 108 | Knicks |
| Field Goals | 34-75 | 40-79 | Knicks |
| Field Goal % | 45% | 51% | Knicks |
| Three-Pointers | 13-34 | 7-26 | 76ers |
| Three-Point % | 38% | 27% | 76ers |
| Free Throws | 21-28 | 21-25 | Knicks efficiency |
| Rebounds | 39 | 37 | 76ers |
| Assists | 20 | 25 | Knicks |
| Turnovers | 18 | 13 | Knicks |
| Steals | 8 | 10 | Knicks |
| Blocks | 6 | 2 | 76ers |
| Offensive Rebounds | 11 | 9 | 76ers |
| Fourth Quarter | 12 | 19 | Knicks |
The table makes the game’s central contradiction clear.
Philadelphia won several traditional hustle categories, including rebounds, offensive rebounds and blocks.
It also shot considerably better from three.
Yet New York won the game because it was more efficient overall, created more assists, protected the ball better and finished stronger.
Frequently Asked Questions
Who was the top scorer in the 76ers vs Knicks game?
Jalen Brunson and Tyrese Maxey both scored 26 points. Brunson’s Knicks won 108-102.
Who led the Knicks in rebounds?
Karl-Anthony Towns led all players with 10 rebounds.
Who had the most assists?
Karl-Anthony Towns recorded seven assists, the highest total in the game.
Which player had the best plus/minus?
OG Anunoby had the best plus/minus among the supplied player statistics at +12.
Which team shot better from three-point range?
Philadelphia shot better from three, making 13 of 34 attempts for about 38 percent. New York made 7 of 26 for about 27 percent.
Why did the Knicks win despite shooting worse from three?
New York made more field goals overall, shot better from the field, committed five fewer turnovers, recorded five more assists and outscored Philadelphia 19-12 in the fourth quarter.
Conclusion
The 76ers vs knicks match player stats from Game 2 show a playoff game decided by execution rather than one overwhelming statistical advantage.
Tyrese Maxey and Jalen Brunson both scored 26 points, but Brunson’s late-game production helped New York close the contest. OG Anunoby delivered an excellent two-way performance with 24 points, five rebounds, four steals and a +12 plus/minus. Karl-Anthony Towns added 20 points, 10 rebounds and seven assists despite limited minutes.
Philadelphia had several statistical advantages. The 76ers shot better from three, collected more rebounds and recorded six blocks. Their problem was that those advantages were not enough to overcome 18 turnovers and a fourth quarter in which they scored only 12 points.
New York’s 108-102 victory was therefore built on overall efficiency and late-game composure. The Knicks shot 51 percent from the field, assisted on 25 baskets and limited their turnovers to 13. Most importantly, they produced the better offensive performance when the game was at its most important stage.
For anyone examining this matchup through a statistical lens, the clearest lesson is that the final box score needs context. Points identify the leading scorers, but shooting efficiency, turnovers, playmaking, rebounding, defensive activity and fourth-quarter execution explain why the Knicks walked away with the victory.