San Antonio Spurs vs Houston Rockets Match Player Stats
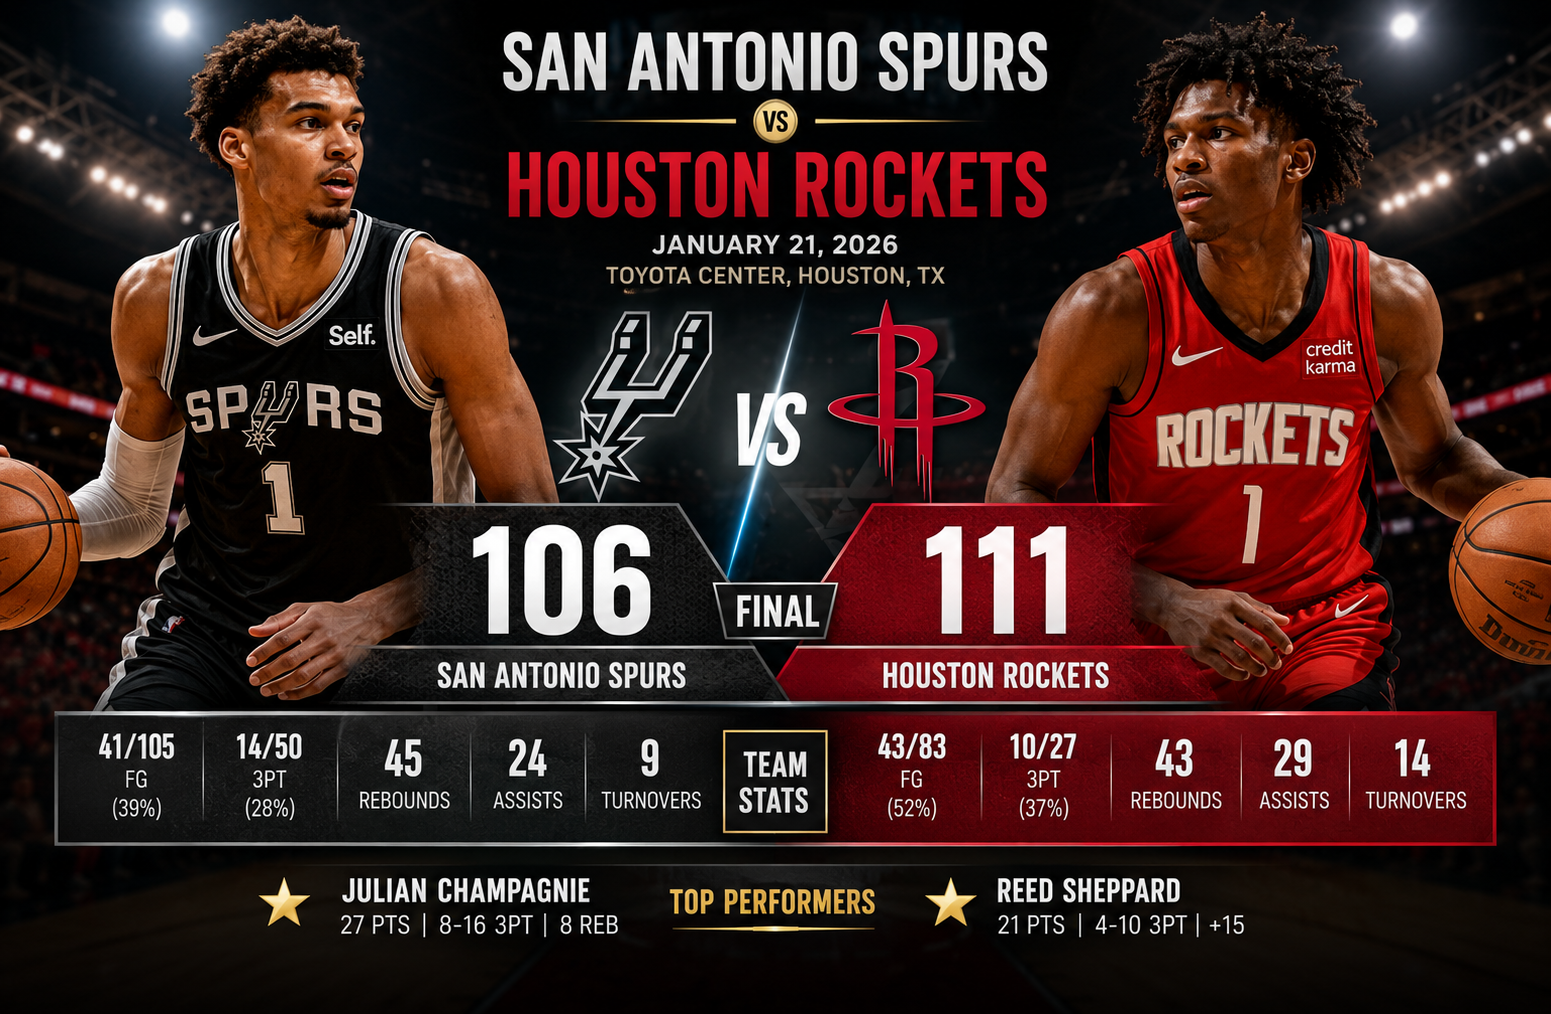
The san antonio spurs vs houston rockets match player stats from the January 2026 meeting tell a much more interesting story than the final score alone. Houston defeated San Antonio 111-106 at Toyota Center after overcoming a 16-point deficit, with Reed Sheppard delivering a decisive fourth-quarter scoring burst and Alperen Sengun controlling the game through rebounding and playmaking. Julian Champagnie led all Spurs scorers with 27 points, while Victor Wembanyama recorded a double-double despite an inefficient shooting night.
The official NBA game record lists the contest as January 20, 2026, with NBA coverage and reporting appearing on January 21. The Rockets’ 111-106 victory made the season series 1-1 at that point.
For anyone studying the box score, the key lesson is that Houston did not win because one player simply overwhelmed San Antonio. The Rockets won because several important areas shifted in their favor after halftime. Houston shot 52% from the field compared with San Antonio’s 39%, produced 29 assists against 24, and finished the game strongly enough to erase San Antonio’s early advantage.
San Antonio Spurs vs Houston Rockets Match Player Stats
The most useful way to understand this matchup is to separate individual production from team efficiency. San Antonio had the leading scorer in Champagnie, the game’s best offensive rebounder in Wembanyama, and strong playmaking contributions from Stephon Castle and De’Aaron Fox. Yet Houston generated more efficient offense and received major fourth-quarter contributions from Sheppard and Sengun.
Final Score and Game Context
| Category | San Antonio Spurs | Houston Rockets |
| Final Score | 106 | 111 |
| Overall Record | 30-14 | 26-15 |
| Home/Away Record | 14-9 away | 15-3 home |
| Field Goals | 41-105 | 43-83 |
| Field-Goal Percentage | 39% | 52% |
| Three-Pointers | 14-50 | 10-27 |
| Three-Point Percentage | 28% | 37% |
| Free Throws | 10-10 | 15-22 |
| Rebounds | 45 | 43 |
| Assists | 24 | 29 |
| Turnovers | 9 | 14 |
| Steals | 7 | 5 |
| Blocks | 5 | 9 |
| Offensive Rebounds | 14 | 6 |
| Defensive Rebounds | 31 | 37 |
| Fouls | 16 | 11 |
The numbers immediately show why the game was close despite Houston’s superior shooting.
San Antonio attempted 22 more field goals than Houston, 105 to 83. That is a huge possession opportunity. The Spurs also committed only nine turnovers and collected 14 offensive rebounds.
Houston, however, converted its opportunities far more efficiently.
The Rockets made 43 of 83 field-goal attempts, while San Antonio needed 105 attempts to make 41 baskets. That difference in shooting efficiency was the foundation of Houston’s comeback.
How the Game Changed Quarter by Quarter
The quarter-by-quarter scoring explains the comeback better than the final score.
| Quarter | Spurs | Rockets |
| First | 39 | 28 |
| Second | 31 | 32 |
| Third | 22 | 22 |
| Fourth | 14 | 29 |
| Total | 106 | 111 |
San Antonio opened the game with an offensive explosion, scoring 39 points in the first quarter. Houston answered with 28.
The Spurs added another 31 points in the second quarter, while the Rockets scored 32. At halftime, San Antonio still held a significant advantage.
The third quarter was even at 22 points apiece.
That left the fourth quarter as the decisive stage.
Houston scored 29 points while limiting San Antonio to only 14. The Rockets therefore won the final quarter by 15 points, completely reversing the game’s trajectory.
NBA’s official live coverage specifically noted that Houston came back from 16 points down and highlighted Sheppard’s 12 fourth-quarter points.
That is the most important statistical clue in the entire game.
The Rockets did not gradually chip away at the deficit over all four quarters. They stayed close enough to remain competitive and then produced a dramatically better closing period.
Julian Champagnie Leads San Antonio’s Scoring
Julian Champagnie was the standout scorer for San Antonio.
He finished with:
- 27 points
- 8-of-17 field goals
- 8-of-16 from three-point range
- 3-of-3 free throws
- 8 rebounds
- 2 assists
- 2 steals
- Plus-5 plus/minus
His three-point shooting deserves particular attention.
Champagnie attempted 16 three-pointers and made eight. That means he generated 24 of his 27 points from beyond the arc.
This was not simply a high-volume scoring performance. It was an extremely efficient perimeter shooting display.
He shot 50% from three-point range and 47.1% overall from the field.
Champagnie’s plus-5 rating also matters because San Antonio’s overall result was negative. He was one of the Spurs players whose minutes coincided with a positive scoring margin.
Yet his performance could not fully compensate for the team’s broader shooting problems.
San Antonio made only 14 of 50 three-point attempts. Champagnie alone accounted for eight of those makes.
That means the rest of the Spurs combined to make only six three-pointers.
This is one of the clearest reasons the Rockets were able to survive such a strong individual performance from Champagnie.
Victor Wembanyama’s Double-Double Came With a Shooting Struggle
Victor Wembanyama finished with 14 points and 10 rebounds, including five offensive rebounds.
His complete statistical line was:
- 14 points
- 5-of-21 field goals
- 0-of-7 three-pointers
- 4-of-4 free throws
- 10 rebounds
- 2 assists
- 1 turnover
- 5 offensive rebounds
- 5 defensive rebounds
- 1 block
- Minus-14 plus/minus
The headline is the double-double.
The deeper story is efficiency.
Wembanyama shot 5-of-21 from the field and missed all seven of his three-point attempts. For a player who can affect the game in so many different ways, this was a particularly difficult offensive night.
However, calling the performance simply “bad” would miss important context.
His five offensive rebounds created additional opportunities for San Antonio. His 10 total rebounds helped the Spurs win the overall rebounding battle 45-43. And his defensive presence also contributed to five total team blocks, although the provided individual data credits him with one block.
The bigger issue was that his missed shots contributed to San Antonio’s extremely high field-goal attempt total.
Wembanyama’s 21 attempts represented one-fifth of San Antonio’s 105 field-goal attempts.
That volume can be valuable when the shots fall. Against Houston, it created a difficult efficiency equation.
De’Aaron Fox Provides Secondary Playmaking
De’Aaron Fox recorded:
- 14 points
- 6-of-15 shooting
- 2-of-6 from three
- 3 rebounds
- 5 assists
- 3 turnovers
- 1 steal
- Minus-7 plus/minus
Fox’s five assists were important, particularly because San Antonio finished with 24 assists as a team.
His six made field goals also provided efficient scoring compared with several of the Spurs’ other high-volume shooters.
Still, his three turnovers were significant in a game where Houston’s offense ultimately produced more assists and more efficient shooting.
Fox was productive, but not dominant enough to compensate for the combination of Wembanyama’s shooting struggles and the team’s poor three-point percentage.
Stephon Castle’s All-Around Contribution
Stephon Castle supplied one of the more balanced lines for San Antonio:
- 13 points
- 5-of-19 field goals
- 2-of-8 from three
- 1-of-1 free throws
- 7 rebounds
- 8 assists
- 3 turnovers
- 1 steal
- 1 block
- Minus-12 plus/minus
The eight assists stand out.
Castle was one of the major reasons San Antonio continued to generate offensive opportunities despite its inefficient shooting.
His seven rebounds also helped the Spurs control the glass.
But Castle’s 5-of-19 shooting shows the same problem that affected the team overall. San Antonio created enough attempts. It simply did not convert enough of them.
This is an important distinction when analyzing NBA box scores. A team can have strong rebounding, low turnovers and respectable assist totals while still losing because the quality and efficiency of its shots are not good enough.
Keldon Johnson and the Supporting Spurs
Keldon Johnson finished with 12 points and six rebounds while shooting 5-of-9 from the field.
He also collected two steals.
His 55.6% shooting was considerably better than San Antonio’s overall 39% mark.
Luke Kornet added eight points on 4-of-5 shooting, six rebounds, one assist and two blocks.
Dylan Harper contributed eight points, three rebounds, five assists, one turnover and one block.
Harrison Barnes scored six points, while Carter Bryant added four.
These contributions mattered because the Spurs needed efficient secondary scoring to support their leading scorers.
The problem was not that San Antonio lacked useful individual performances. The problem was that too few of those performances were efficient enough at the same time.
Reed Sheppard Was the Difference-Maker for Houston
Reed Sheppard was arguably the most influential player in the closing stages.
He finished with:
- 21 points
- 8-of-17 field goals
- 4-of-10 three-pointers
- 1-of-2 free throws
- 2 rebounds
- 4 assists
- 1 steal
- 1 block
- Plus-15 plus/minus
The plus-15 was the highest individual plus/minus in the game.
More importantly, NBA’s official coverage reported that Sheppard scored 12 points in the fourth quarter as Houston completed the comeback.
That fourth-quarter production is why his 21-point total deserves more attention than a basic box-score ranking might suggest.
He was not merely Houston’s leading scorer.
He was the player who delivered when the margin had become most important.
His four made three-pointers also gave Houston valuable spacing. When a team is trying to erase a large deficit, perimeter shooting can dramatically change defensive positioning.
San Antonio could not simply collapse toward the paint when Sheppard was capable of punishing open perimeter opportunities.
Alperen Sengun Controls the Game in Multiple Areas
Alperen Sengun produced one of the most complete statistical lines:
- 20 points
- 7-of-13 field goals
- 1-of-3 three-pointers
- 5-of-5 free throws
- 13 rebounds
- 9 assists
- 4 turnovers
- 2 blocks
- Minus-2 plus/minus
The combination of 20 points, 13 rebounds and nine assists is especially important.
Sengun was one assist away from a triple-double.
His nine assists were also the highest total recorded by any player in the game.
That means Houston’s center was not simply finishing possessions. He was helping create them.
His 13 rebounds led everyone in the matchup, and his two blocks contributed to Houston’s nine total blocks.
This is a perfect example of why traditional points-per-game analysis can be incomplete.
Sengun scored fewer points than Champagnie, but his overall influence was broader. He contributed as a scorer, rebounder, passer and rim protector.
Kevin Durant’s Efficient Playmaking
Kevin Durant finished with:
- 18 points
- 7-of-12 field goals
- 2-of-4 three-pointers
- 2-of-2 free throws
- 4 rebounds
- 7 assists
- 4 turnovers
- 1 steal
- 1 block
- Plus-1 plus/minus
Durant’s 58.3% field-goal shooting was one of Houston’s most efficient high-volume contributions.
His seven assists also show that his value extended beyond scoring.
Although he committed four turnovers, his ability to score efficiently while creating shots for teammates helped Houston maintain offensive flexibility.
The Rockets did not need Durant to score 30 or 40 points.
Instead, they received efficient scoring from him, interior playmaking from Sengun and a late scoring surge from Sheppard.
That distribution of responsibilities made Houston harder to defend.
Jabari Smith Jr. Adds Efficient Frontcourt Scoring
Jabari Smith Jr. scored 17 points on 7-of-13 shooting.
He also made two of five three-point attempts and added four rebounds, one assist and one block.
His 53.8% field-goal shooting fit Houston’s broader efficiency advantage.
Smith’s contribution is easy to overlook when players such as Sengun, Durant and Sheppard dominate the headlines. But his ability to convert more than half of his field-goal attempts helped Houston avoid relying too heavily on one scorer.
Amen Thompson’s Two-Way Impact
Amen Thompson finished with:
- 16 points
- 6-of-14 shooting
- 4-of-5 free throws
- 10 rebounds
- 6 assists
- 3 turnovers
- 1 steal
- 2 blocks
- Plus-7 plus/minus
This was another highly versatile performance.
Thompson joined Sengun as one of Houston’s two players with double-digit rebounds. He also contributed six assists and two blocks.
His plus-7 rating reflects the positive impact of his minutes.
Houston’s depth was therefore a major factor. The Rockets had several players capable of affecting the game without needing to dominate the scoring column.
Houston’s Supporting Cast
Tari Eason added six points, six rebounds, one assist, one steal and one block.
Clint Capela recorded six points, two rebounds and one block.
Josh Okogie scored five points and added a rebound and steal.
Dorian Finney-Smith finished with two points, one rebound and one assist while posting a plus-9 rating.
These numbers show an important feature of the Rockets’ victory.
Houston did not require every player to score heavily.
The team received enough efficient production from its primary contributors, while the supporting players added defense, rebounding and lineup stability.
Shooting Efficiency Decided the Matchup
The single biggest statistical difference was field-goal efficiency.
San Antonio:
41-of-105, 39%
Houston:
43-of-83, 52%
The Rockets made only two more field goals, yet they attempted 22 fewer shots.
That is extraordinary.
It means Houston converted possessions at a much higher rate.
San Antonio’s 105 attempts were partly supported by 14 offensive rebounds and only nine turnovers. Those are normally positive indicators.
But efficiency ultimately outweighed volume.
The Spurs made 14 three-pointers, while Houston made 10. San Antonio therefore had four more made threes.
Yet Houston still won.
Why?
Because Houston was much more accurate overall.
The Rockets also shot 37% from three compared with San Antonio’s 28%.
So even though the Spurs had more made three-pointers, Houston got more value from its overall shooting profile.
The Rebounding Battle Was Close
San Antonio actually won the total rebounding battle:
Spurs: 45
Rockets: 43
The difference becomes more interesting when offensive and defensive rebounds are separated.
San Antonio had 14 offensive rebounds.
Houston had only six.
That gave the Spurs eight more offensive boards.
Yet Houston collected 37 defensive rebounds compared with San Antonio’s 31.
The Rockets were therefore strong at ending San Antonio’s possessions after the initial shot.
This matters because offensive rebounds can compensate for poor shooting by creating additional attempts. San Antonio did exactly that.
But Houston’s defensive rebounding prevented those second chances from becoming even more damaging.
Assists Reveal Houston’s Offensive Structure
Houston finished with 29 assists compared with San Antonio’s 24.
That five-assist advantage is meaningful.
Sengun led Houston with nine assists.
Durant added seven.
Thompson added six.
Sheppard contributed four.
Those four players alone accounted for 26 of Houston’s 29 assists.
This suggests a highly distributed offensive creation structure.
Houston did not depend on one traditional point guard to generate everything.
Instead, multiple players could initiate, pass, attack or create advantages.
San Antonio’s assists were also well distributed, with Castle leading the team at eight and Fox adding five. Harper contributed five as well.
However, the Rockets converted their offensive opportunities more efficiently.
Turnovers Tell a Different Story
San Antonio committed only nine turnovers.
Houston committed 14.
Normally, that would be a strong advantage for the Spurs.
It was.
But Houston’s shooting advantage was so large that the turnover difference was not enough to determine the result.
This is one of the most useful lessons from the box score.
There is no single statistic that explains every NBA game.
A team can lose the turnover battle, lose the offensive-rebounding battle, and still win if it shoots dramatically better.
That is precisely what happened here.
Houston’s Defense Produced Nine Blocks
Houston recorded nine team blocks compared with five for San Antonio.
Sengun had two.
Thompson had two.
Capela had one.
Durant had one.
Eason had one.
Sheppard had one.
Finney-Smith’s supplied line did not include a block.
The overall total still shows how effectively Houston protected the rim and challenged shots.
The Rockets also committed only 11 fouls compared with San Antonio’s 16.
That combination of rim protection and disciplined defense helped Houston survive the Spurs’ high volume of attempts.
Free Throws Were Not the Main Story
San Antonio was perfect from the free-throw line:
10-of-10, 100%
Houston went:
15-of-22, 68%
So free-throw accuracy clearly favored San Antonio.
But the Spurs attempted only 10 free throws.
Houston attempted 22.
The Rockets therefore generated 12 more free-throw attempts.
Even with imperfect accuracy, those additional opportunities produced five more made free throws.
This was another small but meaningful advantage for Houston.
Why San Antonio Lost Despite Several Strong Numbers
The Spurs had several statistical advantages:
- More total rebounds
- More offensive rebounds
- Fewer turnovers
- More steals
- More made three-pointers
- Perfect free-throw shooting
Yet they lost.
The explanation is efficiency.
San Antonio shot 39% overall and 28% from three.
Houston shot 52% overall and 37% from three.
The Spurs also received only 14 points from Wembanyama on 5-of-21 shooting.
That combination created too much pressure on Champagnie and the rest of the supporting cast.
San Antonio produced enough possessions to win the game.
It did not convert enough of them.
Why Houston Won the Fourth Quarter
The fourth quarter deserves its own analysis because that is where the game was decided.
Houston scored 29 points.
San Antonio scored 14.
That 15-point difference was greater than Houston’s final five-point margin.
In other words, if the game had simply remained close to the previous three quarters’ scoring pattern, San Antonio would likely have maintained control.
Instead, Houston dramatically changed the game’s offensive efficiency.
Sheppard’s 12 fourth-quarter points were particularly important. NBA’s official account specifically identified his late scoring as a key component of the comeback.
The Rockets also benefited from Sengun’s ability to create offense and from the overall efficiency of their shot selection.
Most Important Individual Performances
Based strictly on the supplied box-score data and the game’s context, the strongest performances can be separated into different categories.
Best Scorer
Julian Champagnie, 27 points
His 8-of-16 three-point shooting was the most impressive pure scoring display.
Best Overall Statistical Line
Alperen Sengun, 20 points, 13 rebounds, 9 assists
He influenced nearly every major category.
Biggest Fourth-Quarter Impact
Reed Sheppard
His 12 fourth-quarter points helped Houston complete the comeback.
Best Plus/Minus
Reed Sheppard, +15
No player finished with a higher plus/minus.
Best Rebounding Performance
Alperen Sengun, 13 rebounds
He led all players on the glass.
Best Playmaking Performance
Alperen Sengun, 9 assists
His passing from the center position was a major part of Houston’s offensive success.
Most Efficient High-Volume Spurs Scorer
Julian Champagnie
He made 8 of 17 field goals and 8 of 16 three-pointers.
What the Box Score Says About Victor Wembanyama
The most nuanced conclusion from this game concerns Wembanyama.
A 14-point, 10-rebound performance does not fully capture his impact or his struggles.
His five offensive rebounds were valuable. His length and defensive presence remained important. But his 5-of-21 shooting meant that San Antonio did not receive the efficient offensive production it needed from its franchise centerpiece.
The zero-for-seven three-point line is especially notable.
Wembanyama does not need to make every outside shot to be effective. But when seven perimeter attempts do not produce a single make, those possessions become costly in a five-point game.
The lesson is not that Wembanyama should avoid perimeter shooting entirely.
Rather, the box score demonstrates how important shot efficiency becomes when a team is facing an opponent capable of converting at 52%.
What the Matchup Reveals About San Antonio
San Antonio’s statistical profile suggests a team capable of generating possessions but vulnerable to inefficient shooting stretches.
The Spurs:
- Rebounded well
- Protected the ball
- Created second chances
- Generated 24 assists
- Made 14 three-pointers
- Forced five Houston turnovers
Those are useful building blocks.
But the 39% field-goal percentage and 28% three-point percentage were major obstacles.
San Antonio’s challenge in games like this is therefore not necessarily creating more opportunities.
It is turning existing opportunities into efficient points.
What the Matchup Reveals About Houston
Houston’s performance showed the value of offensive versatility.
The Rockets had:
- A 20-point scorer in Sengun
- A 21-point scorer in Sheppard
- An 18-point scorer in Durant
- A 17-point scorer in Smith
- A 16-point scorer in Thompson
Five players reached at least 16 points.
That distribution is difficult for an opponent to neutralize.
If one scorer is contained, another can step forward.
The Rockets also had three players with at least six assists or close to that level of playmaking influence: Sengun had nine, Durant had seven, and Thompson had six.
That is a major reason Houston’s offense could adapt during the comeback.
Head-to-Head Season Series Context
The January matchup brought the season series to 1-1.
San Antonio had previously defeated Houston 121-110 on November 7, 2025, while Houston answered with the 111-106 victory in this meeting. The Spurs’ official season notes confirm the earlier result and the January loss.
The teams met again later in January, when San Antonio won 111-99 in Houston. NBA coverage reported that Wembanyama led that game with 28 points, 16 rebounds and five blocks.
That later result adds useful context to the January 20 matchup. The Rockets’ comeback was significant, but it was not evidence that Houston had permanently solved San Antonio. The subsequent meeting demonstrated how quickly the matchup could change.
How to Read These Player Stats Correctly
Readers often make one mistake when analyzing NBA player statistics: they focus entirely on points.
Points are important, but they do not explain the entire game.
For this matchup, a better analysis considers at least six areas:
- Scoring efficiency: Houston shot 52% versus 39%.
- Three-point efficiency: Houston shot 37% versus 28%.
- Possession creation: San Antonio had 14 offensive rebounds.
- Ball security: San Antonio committed nine turnovers.
- Playmaking: Houston had 29 assists.
- Closing performance: Houston won the fourth quarter 29-14.
Together, those numbers explain the outcome much more effectively than simply saying Houston won by five.
Key Statistical Takeaways
The most important lessons from this matchup can be summarized clearly.
Houston won through efficiency.
The Rockets did not need more field-goal attempts because they converted their existing attempts at a much higher rate.
San Antonio won the second-chance battle.
Fourteen offensive rebounds gave the Spurs extra opportunities.
Houston won the passing battle.
The Rockets recorded 29 assists, with Sengun leading the way.
Reed Sheppard changed the fourth quarter.
His 12 points in the final period were crucial to Houston’s comeback.
Sengun nearly recorded a triple-double.
His 20 points, 13 rebounds and nine assists made him one of the game’s most complete contributors.
Champagnie was San Antonio’s scoring star.
His 27 points and eight made threes were outstanding.
Wembanyama’s shooting efficiency was a major factor.
His 14 points came on 5-of-21 shooting, including 0-of-7 from three.
The fourth quarter decided everything.
Houston outscored San Antonio 29-14 over the final 12 minutes.
San Antonio Spurs vs Houston Rockets Match Player Stats: Complete Player Table
| Spurs Player | PTS | FG | 3PT | REB | AST | STL | BLK | +/- |
| Julian Champagnie | 27 | 8-17 | 8-16 | 8 | 2 | 2 | 0* | +5 |
| Victor Wembanyama | 14 | 5-21 | 0-7 | 10 | 2 | 0* | 1 | -14 |
| De’Aaron Fox | 14 | 6-15 | 2-6 | 3 | 5 | 1 | 0* | -7 |
| Stephon Castle | 13 | 5-19 | 2-8 | 7 | 8 | 1 | 1 | -12 |
| Keldon Johnson | 12 | 5-9 | N/A | 6 | N/A | 2 | N/A | -2 |
| Luke Kornet | 8 | 4-5 | N/A | 6 | 1 | N/A | 2 | +3 |
| Dylan Harper | 8 | 4-9 | N/A | 3 | 5 | N/A | 1 | +2 |
| Harrison Barnes | 6 | 2-6 | 2-5 | 2 | 1 | 1 | 1 | -2 |
| Carter Bryant | 4 | 2-4 | N/A | 0 | 0 | N/A | N/A | +2 |
* Individual statistics not supplied in the provided data are not assumed.
| Rockets Player | PTS | FG | 3PT | REB | AST | STL | BLK | +/- |
| Reed Sheppard | 21 | 8-17 | 4-10 | 2 | 4 | 1 | 1 | +15 |
| Alperen Sengun | 20 | 7-13 | 1-3 | 13 | 9 | N/A | 2 | -2 |
| Kevin Durant | 18 | 7-12 | 2-4 | 4 | 7 | 1 | 1 | +1 |
| Jabari Smith Jr. | 17 | 7-13 | 2-5 | 4 | 1 | N/A | 1 | +1 |
| Amen Thompson | 16 | 6-14 | N/A | 10 | 6 | 1 | 2 | +7 |
| Tari Eason | 6 | 3-6 | N/A | 6 | 1 | 1 | 1 | -3 |
| Clint Capela | 6 | 2-3 | N/A | 2 | N/A | N/A | 1 | +6 |
| Josh Okogie | 5 | 2-2 | 1-1 | 1 | N/A | 1 | N/A | -9 |
| Dorian Finney-Smith | 2 | 1-3 | N/A | 1 | 1 | N/A | N/A | +9 |
Frequently Asked Questions
Who led the Spurs in scoring against the Rockets?
Julian Champagnie led San Antonio with 27 points. He shot 8-of-17 from the field and 8-of-16 from three-point range.
Who led the Rockets in scoring?
Reed Sheppard led Houston with 21 points. He made 8 of 17 field-goal attempts and four three-pointers.
Who had the most rebounds?
Alperen Sengun led all players with 13 rebounds. Amen Thompson and Victor Wembanyama each recorded 10.
Who had the most assists?
Alperen Sengun led the game with nine assists. Stephon Castle recorded eight for San Antonio, while Kevin Durant had seven for Houston.
Why did Houston beat San Antonio?
Houston won primarily because of superior shooting efficiency and a dominant fourth quarter. The Rockets shot 52% from the field compared with 39% for San Antonio and outscored the Spurs 29-14 in the fourth.
What was Victor Wembanyama’s stat line?
Wembanyama finished with 14 points, 10 rebounds, two assists and one block. He shot 5-of-21 from the field and 0-of-7 from three-point range.
Conclusion
The san antonio spurs vs houston rockets match player stats reveal a game in which efficiency ultimately defeated volume.
San Antonio created more opportunities. The Spurs grabbed 14 offensive rebounds, committed only nine turnovers and made 14 three-pointers. Champagnie delivered an exceptional perimeter scoring performance, while Castle contributed eight assists and Wembanyama collected 10 rebounds.
Houston, however, made better use of its possessions.
The Rockets shot 52% from the field, made 37% of their three-point attempts and finished with 29 assists. Sengun came close to a triple-double with 20 points, 13 rebounds and nine assists. Durant supplied efficient scoring and seven assists. Thompson added 16 points, 10 rebounds and six assists.
Then came Sheppard.
His 12 fourth-quarter points were a defining part of Houston’s comeback. The Rockets turned a 16-point deficit into a five-point victory by winning the final period 29-14. That closing run transformed what looked like a comfortable San Antonio victory into one of Houston’s most memorable regular-season comebacks.
The most important takeaway is therefore not simply that Houston scored 111 points or that San Antonio scored 106. The deeper lesson is how the teams reached those totals. San Antonio relied on volume and second chances but struggled with shooting efficiency. Houston produced fewer attempts but converted them at a much higher rate and received balanced playmaking from multiple players.
For readers analyzing NBA box scores, this is exactly why player statistics should be studied together rather than individually. Points identify the headline performers, but shooting percentage, assists, rebounds, turnovers, plus/minus and fourth-quarter production explain how the game was actually won.