Tennessee Titans vs Las Vegas Raiders Match Player Stats
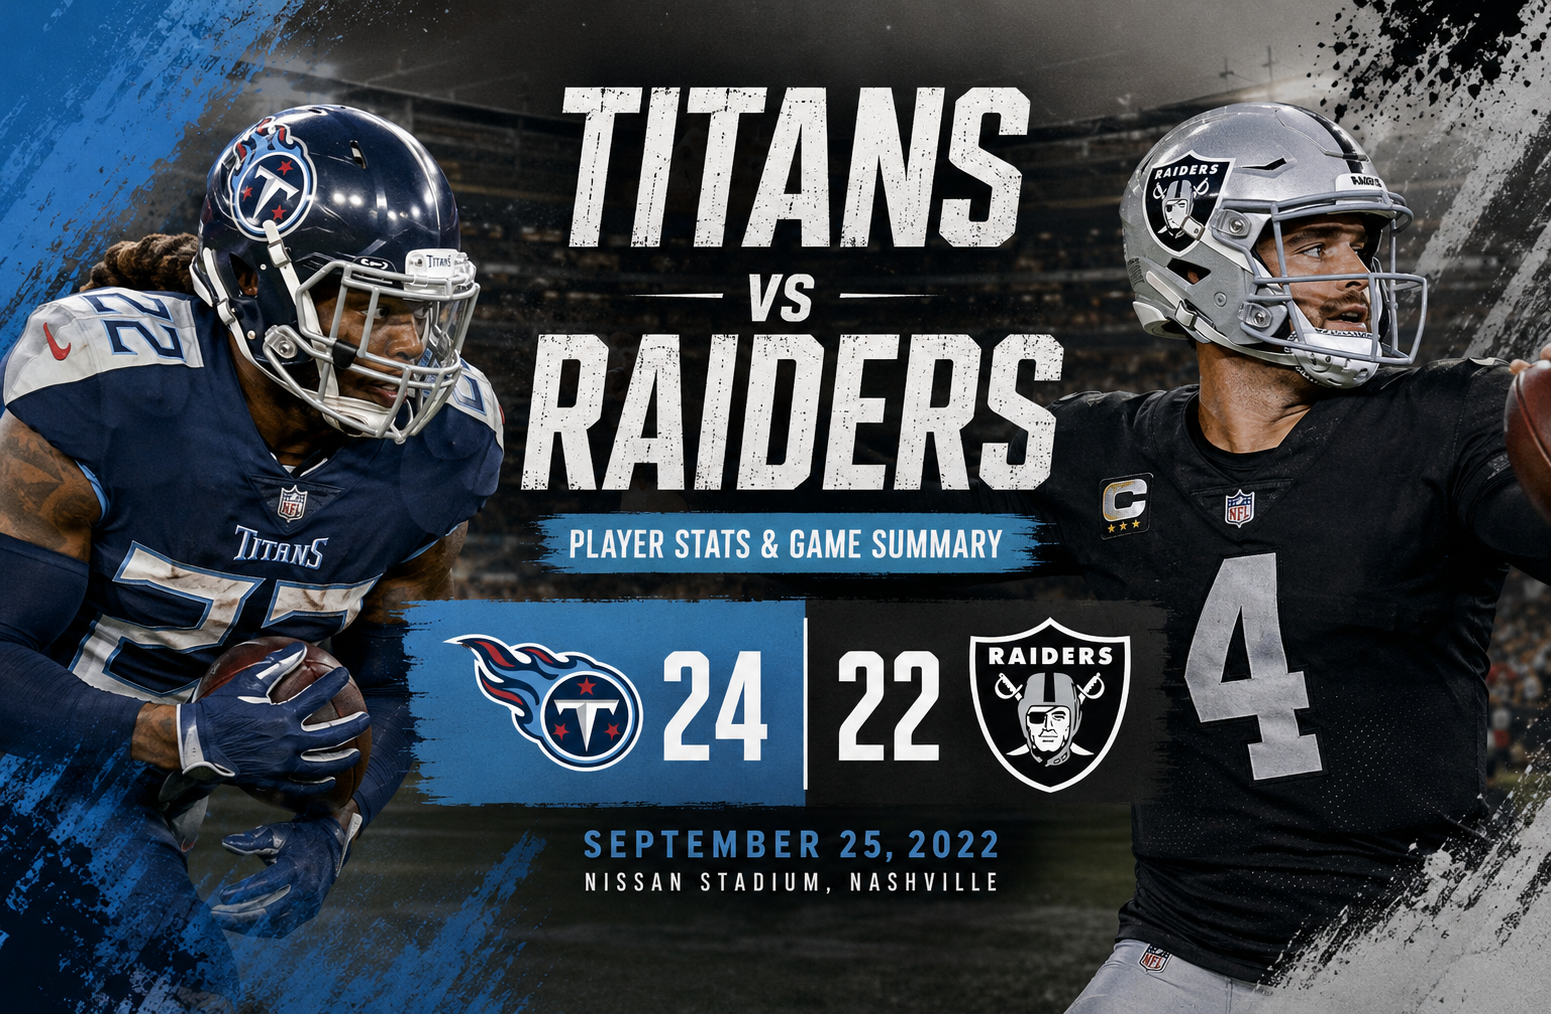
The Tennessee Titans vs Las Vegas Raiders match player stats from September 25, 2022 tell the story of a close game that was decided by Tennessee’s strong second quarter, efficient passing, and ability to build a 14 point lead before surviving a late Raiders comeback. The Titans won 24-22 at Nissan Stadium, improving to 1-2 while Las Vegas fell to 0-3. The final score looked close, but the game developed in very different phases, with Tennessee scoring 24 unanswered points across the first two quarters before Las Vegas attempted to erase the deficit after halftime.
For readers looking beyond the final score, this matchup offers a useful example of why individual statistics need context. Derek Carr threw for 303 yards and two touchdowns, while Ryan Tannehill completed 19 of 27 passes for 264 yards and one touchdown. Josh Jacobs produced 66 rushing yards, Derrick Henry delivered 85 rushing yards and a touchdown, and Mack Hollins had the standout receiving performance with 158 yards and a touchdown. Yet none of those numbers alone explains why Tennessee walked away with the victory.
The Titans controlled the game most effectively in the first half. They scored 7 points in the opening quarter and 17 in the second, taking a 24-10 lead into halftime. Las Vegas then outscored Tennessee 12-0 over the final two quarters, but the Raiders could not complete the comeback.
Tennessee Titans vs Las Vegas Raiders Match Player Stats: Game Overview
The matchup took place on Sunday, September 25, 2022, at Nissan Stadium in Nashville. Tennessee entered the contest 0-2 after losses to the New York Giants and Buffalo Bills, while Las Vegas was also 0-2 following defeats against the Los Angeles Chargers and Arizona Cardinals. The Titans eventually secured their first victory of the season, while the Raiders dropped to 0-3.
| Category | Las Vegas Raiders | Tennessee Titans |
| Final Score | 22 | 24 |
| First Quarter | 3 | 7 |
| Second Quarter | 7 | 17 |
| Third Quarter | 3 | 0 |
| Fourth Quarter | 9 | 0 |
| Total Yards | 396 | 361 |
| Passing Yards | 300 | 252 |
| Rushing Yards | 96 | 109 |
| First Downs | 24 | 19 |
| Turnovers | 1 | 1 |
| Sacks Allowed | 1 | 1 |
One of the most interesting details is that Las Vegas actually produced more total offense. The Raiders accumulated 396 yards compared with Tennessee’s 361. They also produced 24 first downs compared with Tennessee’s 19.
That makes the final result more revealing rather than less. Tennessee did not win simply because it gained more yards. The Titans were more effective with their opportunities early, created a substantial halftime advantage, and then held on when Las Vegas mounted its late push.
How the Game Unfolded
The opening quarter was relatively balanced. Tennessee struck first when Geoff Swaim caught a two-yard touchdown pass from Tannehill. Daniel Carlson later converted a 21-yard field goal for Las Vegas, leaving Tennessee ahead 7-3 after one quarter.
The second quarter changed the entire shape of the game.
Derrick Henry scored on a one-yard rushing touchdown to extend Tennessee’s lead to 14-3. Las Vegas answered through Davante Adams, who caught a five-yard touchdown pass from Carr. Tennessee then responded again, this time with Tannehill scoring on a one-yard rushing touchdown.
Randy Bullock added a 48-yard field goal as the first half expired, giving Tennessee a 24-10 advantage.
That 14-point margin became critical.
Las Vegas scored only three points in the third quarter, but Carlson’s 35-yard field goal in the fourth reduced the gap further. With 1:14 remaining, Carr found Mack Hollins for a nine-yard touchdown. The Raiders then attempted to make the score even closer with a two-point conversion, but the pass failed. The Titans ultimately held on for the 24-22 victory.
Ryan Tannehill Player Stats
Ryan Tannehill produced one of the most efficient statistical performances of the game despite not throwing for as many yards as Carr.
His final passing line was:
- 19 completions
- 27 attempts
- 264 passing yards
- 1 touchdown
- 1 interception
- 9.8 yards per attempt
- 98.4 passer rating
- 1 sack for 12 yards
Tannehill also contributed on the ground with four rushing attempts for two yards and a touchdown.
The completion percentage is particularly important. Tannehill completed 70.4 percent of his passes, giving Tennessee a reliable passing element without requiring a high-volume aerial attack.
His 9.8 yards per attempt also indicates that the Titans were not merely relying on short completions. Tennessee’s passing offense generated meaningful yardage when Tannehill connected with his receivers.
The interception and sack prevented the performance from being perfect, but the overall efficiency was strong enough to complement Henry’s rushing workload.
Tannehill’s Most Important Contribution
The most significant part of Tannehill’s performance was not simply his passing total. It was his ability to help Tennessee build the early lead.
His rushing touchdown in the second quarter gave the Titans a 21-10 advantage. That score was part of a dominant 17-point second quarter for Tennessee.
When evaluating quarterback performance, game situation matters. A quarterback who produces efficiently while his team builds a large lead can have a greater impact on the final result than raw passing volume suggests.
Derek Carr Player Stats
Derek Carr had the bigger passing yardage total.
His final numbers were:
- 26 completions
- 44 attempts
- 303 passing yards
- 2 touchdowns
- 1 interception
- 6.9 yards per attempt
- 85.7 passer rating
- 1 sack for 7 yards
Carr also rushed twice for 17 yards.
His 303 passing yards represented the highest individual passing total in the game. Las Vegas also finished with 300 team passing yards, showing that Carr was responsible for virtually all of the team’s aerial production.
However, Carr’s performance demonstrates an important distinction between volume and game control.
He threw the ball 44 times because the Raiders spent much of the game trying to overcome Tennessee’s early advantage. His yardage increased as Las Vegas moved into comeback mode, but the Raiders could not convert that production into enough points to complete the comeback.
Carr’s late touchdown pass to Hollins brought Las Vegas within two points. The failed two-point attempt left the Raiders needing another score, but Tennessee prevented the final comeback.
Derrick Henry Player Stats
Derrick Henry remained central to Tennessee’s offensive identity.
His rushing statistics were:
- 20 carries
- 85 rushing yards
- 4.3 yards per carry
- 1 rushing touchdown
- 24-yard longest run
Henry also caught five passes for 58 yards.
That gave him 143 total yards from scrimmage.
His receiving contribution is especially noteworthy. Henry was not simply used as a traditional early-down running back. Five receptions for 58 yards meant he also provided a valuable outlet in the passing game.
His 23-yard reception was his longest catch, adding another explosive element to his workload.
Why Henry’s Numbers Matter
An 85-yard rushing performance may not look overwhelming by itself, particularly when compared with some of Henry’s larger statistical games.
The context matters.
Tennessee had 27 rushing attempts for 109 yards, while Henry handled 20 of those carries. He also scored the rushing touchdown that helped establish Tennessee’s second-quarter advantage.
The Titans did not need Henry to produce a massive rushing total because their passing game was efficient enough to prevent Las Vegas from completely focusing on the running game.
Henry’s contribution was therefore about balance, scoring, and sustained offensive pressure rather than simply chasing a high rushing total.
Josh Jacobs Player Stats
Josh Jacobs led the Raiders in rushing with:
- 13 carries
- 66 yards
- 5.1 yards per carry
- 0 rushing touchdowns
- 13-yard longest run
He also caught five passes for 31 yards.
That gave Jacobs 97 yards from scrimmage.
His 5.1 yards per carry was actually better than Henry’s 4.3, although Jacobs received seven fewer rushing attempts.
This is a good example of why comparing running backs only by rushing yards can be misleading. Jacobs was productive when given opportunities, but Tennessee’s early lead forced Las Vegas into a more pass-heavy offensive approach.
Jacobs also had a fumble that he recovered, meaning the turnover did not become a possession-changing mistake.
Mack Hollins Was the Raiders’ Biggest Receiving Story
The most eye-catching receiving performance belonged to Mack Hollins.
Hollins finished with:
- 8 receptions
- 158 yards
- 19.8 yards per reception
- 1 touchdown
- 60-yard longest reception
- 11 targets
His 158 receiving yards were more than half of Las Vegas’ listed receiving production from the primary players in the game.
The 60-yard reception was especially important because it demonstrated the Raiders’ ability to generate explosive plays.
Hollins’ touchdown came late in the fourth quarter and reduced Tennessee’s lead to 24-22. His performance was therefore both statistically impressive and directly connected to the final comeback attempt.
Hollins vs. the Rest of the Raiders Receivers
Davante Adams entered the game as one of the Raiders’ most prominent offensive weapons, and he did score a touchdown.
However, his receiving line was much quieter:
- 5 receptions
- 36 yards
- 7.2 yards per reception
- 1 touchdown
- 10 targets
Foster Moreau added three receptions for 44 yards, while Darren Waller recorded three receptions for 22 yards.
This distribution shows how heavily Hollins influenced the passing attack in this particular matchup.
Adams’ touchdown mattered on the scoreboard, but Hollins created substantially more yardage.
Tennessee’s Receiving Leaders
Robert Woods led the Titans in receiving yards.
His line included:
- 4 receptions
- 85 yards
- 21.3 yards per reception
- 41-yard longest reception
- 9 targets
Derrick Henry followed with five receptions for 58 yards. Nick Westbrook-Ikhine added three receptions for 40 yards.
The Titans’ receiving production was spread across several players rather than being dominated by one player.
Geoff Swaim caught three passes for 19 yards and scored Tennessee’s opening touchdown. Austin Hooper recorded two receptions for 19 yards, while Dontrell Hilliard caught one pass for 30 yards.
That distribution helped Tennessee maintain offensive flexibility.
Team Passing Comparison
The passing comparison provides an interesting contrast.
| Passing Category | Raiders | Titans |
| Completions | 27 | 19 |
| Attempts | 45 | 27 |
| Passing Yards | 300 | 252 |
| Touchdowns | 2 | 1 |
| Interceptions | 1 | 1 |
| Sacks | 1 | 1 |
| Yards per Attempt | 6.8 | 9.8 |
The Raiders threw substantially more often. Their 45 team attempts compared with Tennessee’s 27 illustrate the difference in game script.
Tennessee could stay balanced because it held the lead.
Las Vegas had to throw more frequently because it was chasing the scoreboard.
This distinction is essential when studying quarterback statistics. A higher passing volume does not automatically indicate a better offensive performance.
Team Rushing Comparison
Tennessee had the edge on the ground.
The Titans finished with:
- 27 carries
- 109 yards
- 4.0 yards per carry
- 2 rushing touchdowns
- 24-yard longest run
Las Vegas finished with:
- 19 carries
- 96 yards
- 5.1 yards per carry
- 0 rushing touchdowns
- 13-yard longest run
The Raiders actually averaged more yards per rushing attempt, but Tennessee scored both rushing touchdowns.
That scoring difference was decisive.
Henry scored on a one-yard run, while Tannehill added another rushing touchdown. Those two rushing scores accounted for 12 of Tennessee’s 24 points.
Defensive Player Stats
The defensive numbers were relatively close.
Las Vegas recorded 60 total tackles, 41 solo tackles, one sack, two tackles for loss, five passes defended, and five quarterback hits.
Tennessee recorded 62 total tackles, 40 solo tackles, one sack, four tackles for loss, six passes defended, and five quarterback hits.
Maxx Crosby led the Raiders defense with:
- 9 total tackles
- 5 solo tackles
- 1 sack
- 2 tackles for loss
- 1 pass defended
- 1 quarterback hit
For Tennessee, Roger McCreary recorded a team-high 10 total tackles and nine solo tackles, along with one pass defended.
The defensive statistics show that neither side completely overwhelmed the opposing offense.
Instead, the difference came from timing.
Tennessee’s defense produced enough resistance to protect the early lead, while the Raiders defense struggled to prevent the Titans from scoring 24 points before halftime.
Turnovers and Defensive Plays
Each team recorded one interception.
Las Vegas’ Duron Harmon intercepted Tannehill and returned the ball 13 yards.
Tennessee’s Kevin Byard intercepted Carr and returned the ball 24 yards.
Neither team lost a fumble.
This creates an unusual balance in the turnover category. Both teams committed one interception, and neither lost a fumble.
As a result, turnovers alone do not explain the result.
The more important factor was when the points were scored.
Tennessee turned its early offensive success into a 24-10 halftime advantage. Las Vegas then had to spend the rest of the game attempting to recover from that deficit.
Special Teams Impact
Special teams quietly contributed to the final margin.
Daniel Carlson was perfect on field goals for Las Vegas, converting all three attempts and adding the Raiders’ only extra point. He finished with 10 points. His longest field goal was 35 yards.
Randy Bullock converted his only field-goal attempt for Tennessee, a 48-yarder, and made all three extra points. He finished with six points.
The field-position battle also contained a notable difference in punting.
AJ Cole averaged 48.0 yards across three punts for Las Vegas.
Ryan Stonehouse averaged 60.3 yards across three punts for Tennessee, including a 70-yard punt and two punts inside the 20-yard line.
Those numbers illustrate the value of hidden field position. Even when an offense does not score, strong punting can force the opponent to travel a greater distance.
Why Tennessee Won Despite Gaining Fewer Yards
This is probably the most important analytical question in the game.
Las Vegas gained 396 total yards.
Tennessee gained 361.
Yet Tennessee won.
The explanation is the combination of scoring efficiency, first-half execution, and game state.
The Titans scored 24 points through two quarters. The Raiders scored only 10.
After halftime, Las Vegas outscored Tennessee 12-0, but the deficit was too large.
This is why a final box score should not be interpreted simply as a contest of total yardage.
A team can gain more yards and still lose if it struggles to turn those yards into touchdowns or allows the opponent to build a large early advantage.
The Importance of the Second Quarter
The second quarter was the defining period.
Tennessee scored 17 points.
Las Vegas scored 7.
The Titans entered halftime with a 24-10 lead.
That quarter included:
- Derrick Henry’s one-yard rushing touchdown.
- Davante Adams’ five-yard receiving touchdown for Las Vegas.
- Ryan Tannehill’s one-yard rushing touchdown.
- Randy Bullock’s 48-yard field goal.
The sequence established the game’s central pattern.
Tennessee repeatedly answered Las Vegas and continued to increase its advantage.
For the Raiders, the problem was not a lack of offensive production over the entire game. The problem was that their best comeback effort came after Tennessee had already created a substantial cushion.
The Fourth-Quarter Comeback Attempt
Las Vegas entered the fourth quarter trailing 24-16.
Carlson’s 35-yard field goal reduced Tennessee’s advantage to five points.
The Raiders then needed a touchdown.
With 1:14 remaining, Carr connected with Hollins for a nine-yard touchdown. Instead of tying the game with a successful two-point conversion, Las Vegas failed on the attempt, leaving the score 24-22.
That decision gave the Raiders a chance to take the lead with another possession, but the comeback did not materialize.
The sequence shows how small margins become decisive in a two-point game.
A single successful conversion could have changed the end-game situation completely.
What the Player Statistics Reveal
The raw numbers reveal several deeper patterns.
1. Carr produced more passing volume
Carr threw 44 passes compared with Tannehill’s 27 attempts.
That was partly a consequence of the score.
The Raiders were forced into a higher-volume passing approach because they spent most of the game trailing.
2. Tannehill was more efficient
Tannehill completed 70.4 percent of his attempts and averaged 9.8 yards per attempt.
Carr completed 59.1 percent of his attempts and averaged 6.9 yards per attempt.
Carr gained more total passing yards, but Tannehill’s efficiency helped Tennessee create points more quickly.
3. Henry affected the game in multiple ways
Henry produced 85 rushing yards and 58 receiving yards.
His combined 143 yards from scrimmage made him one of Tennessee’s most important offensive players.
4. Hollins was the Raiders’ explosive weapon
Hollins averaged 19.8 yards per reception and produced a 60-yard catch.
He was responsible for a major portion of the Raiders’ big-play production.
5. Tennessee scored more rushing touchdowns
The Titans scored two rushing touchdowns.
The Raiders scored none.
That difference helped Tennessee turn offensive possessions into points.
Tennessee’s Offensive Balance
One reason the Titans were able to build their lead was the interaction between their rushing and passing attacks.
Henry received 20 carries, while Tannehill attempted 27 passes.
That is a relatively balanced distribution.
Tennessee did not abandon the run, but it also did not force Henry to carry the entire offense.
The result was a game plan that could attack the Raiders in multiple ways.
Robert Woods averaged 21.3 yards per reception, while Henry averaged 11.6 yards on his five catches. That gave Tannehill useful opportunities to generate yardage without requiring 40-plus pass attempts.
Las Vegas’ Offensive Challenge
Las Vegas’ offensive production was good enough to win many games.
The Raiders gained 396 yards.
Carr threw for 303 yards.
Hollins produced 158 receiving yards.
Jacobs averaged 5.1 yards per carry.
Yet the team scored only 22 points.
The central issue was therefore not simply production.
It was conversion.
Las Vegas generated yards, but Tennessee had already established enough scoreboard control to make those yards less valuable late in the game.
The Raiders also had to settle for three Carlson field goals. Field goals kept them within range, but Tennessee’s early touchdowns created the larger problem.
A Closer Look at Davante Adams
Adams finished with five catches for 36 yards and a touchdown.
His 10 targets were tied to a substantial portion of Carr’s passing volume, but the yardage output was modest compared with his normal role as a premier receiver.
His touchdown came in the second quarter on a five-yard pass from Carr.
From an analytical perspective, Adams’ performance demonstrates why targets and receiving yards should be considered together.
Ten targets show that the quarterback continued to look toward him, but those opportunities did not translate into a large yardage total.
Meanwhile, Hollins converted 11 targets into 158 yards.
The contrast between the two receiving performances was one of the most striking statistical features of the game.
A Closer Look at Robert Woods
Robert Woods was Tennessee’s leading receiver by yardage.
His four receptions produced 85 yards, which means he averaged 21.3 yards per catch.
His 41-yard reception was the longest catch for the Titans.
That explosive play helped Tennessee maintain its ability to generate meaningful yardage without relying entirely on short throws.
Woods did not need a huge reception total to have a substantial impact.
This is another useful lesson from the box score: reception volume and offensive importance are not always directly proportional.
What the Box Score Says About Field Position
Tennessee’s punting numbers stand out.
Stonehouse averaged 60.3 yards per punt and had a 70-yard long.
Two of his three punts finished inside the 20-yard line.
That combination suggests Tennessee was capable of flipping field position when possessions stalled.
Las Vegas’ AJ Cole also had a strong statistical outing, averaging 48.0 yards per punt and placing two punts inside the 20.
The difference in raw punting average was significant, although punting numbers should always be interpreted alongside return yardage, field location, and situation.
Comparing the Quarterbacks Fairly
A common mistake in post-game analysis is to compare quarterbacks solely by passing yards.
That would favor Carr.
A more complete comparison shows a closer contest.
| Quarterback | Comp/Att | Yards | TD | INT | YPA | Rating |
| Derek Carr | 26/44 | 303 | 2 | 1 | 6.9 | 85.7 |
| Ryan Tannehill | 19/27 | 264 | 1 | 1 | 9.8 | 98.4 |
Carr produced 39 more passing yards and one additional touchdown.
Tannehill attempted 17 fewer passes, averaged nearly three more yards per attempt, and finished with the higher passer rating.
The statistics therefore suggest two different styles of quarterback performance.
Carr was the higher-volume passer in a comeback-oriented game script.
Tannehill was the more efficient passer while playing with a lead.
Comparing Henry and Jacobs
The running back comparison is similarly interesting.
| Player | Carries | Rush Yards | YPC | Rush TD | Receptions | Rec Yards |
| Derrick Henry | 20 | 85 | 4.3 | 1 | 5 | 58 |
| Josh Jacobs | 13 | 66 | 5.1 | 0 | 5 | 31 |
Jacobs had the higher rushing average.
Henry had more carries, more rushing yards, a rushing touchdown, and significantly more receiving yards.
Henry’s 143 yards from scrimmage compared with Jacobs’ 97 demonstrate why the Tennessee back had the larger overall statistical footprint.
The Defensive Leaders
Roger McCreary’s 10 tackles led Tennessee.
Maxx Crosby led Las Vegas with nine tackles and added a sack.
Neither defense produced multiple sacks, and both recorded five quarterback hits.
Tennessee did, however, record four tackles for loss compared with two for Las Vegas.
The defensive battle was therefore not defined by overwhelming pressure.
Instead, both teams relied on tackling, coverage, and individual plays to prevent the opposing offense from fully controlling the game.
Historical Context of the Result
The September 25 meeting was part of the 2022 regular season and represented Week 3 for both teams.
The Titans entered at 0-2 and left at 1-2.
The Raiders entered at 0-2 and left at 0-3.
The result proved important for Tennessee’s early-season momentum. The Titans subsequently defeated Indianapolis the following week, moving to 2-2. Las Vegas eventually recorded its first win of the season against Denver in Week 4.
For anyone researching this game today, it is important to keep the historical context clear. These statistics belong to the September 25, 2022 matchup, not a current-season meeting.
Most Important Player Performances
Based strictly on the supplied game statistics, several performances stand out.
Best Titans Offensive Performer: Derrick Henry
Henry’s combination of 85 rushing yards, one rushing touchdown, five receptions, and 58 receiving yards gave him 143 yards from scrimmage.
Most Efficient Titans Quarterback Performance: Ryan Tannehill
Tannehill completed 19 of 27 passes for 264 yards, one touchdown, and a 98.4 passer rating.
Best Raiders Receiver: Mack Hollins
Hollins produced eight catches for 158 yards and a touchdown, including a 60-yard reception.
Highest Raiders Passing Output: Derek Carr
Carr completed 26 of 44 attempts for 303 yards and two touchdowns.
Defensive Standout: Roger McCreary
McCreary led Tennessee with 10 total tackles and nine solo tackles.
Raiders Defensive Standout: Maxx Crosby
Crosby recorded nine total tackles, one sack, two tackles for loss, one pass defended, and one quarterback hit.
Key Takeaways From the Match
The most useful lessons from this game can be summarized in several points.
Tennessee’s first-half execution was decisive. The Titans scored 24 points before halftime and created a deficit that Las Vegas could not fully erase.
Las Vegas produced more total yardage but lost the game. This is a clear reminder that yardage does not equal points.
Tannehill was more efficient than Carr. Carr produced more passing yards, but Tannehill required far fewer attempts to generate 252 team passing yards.
Henry contributed as both runner and receiver. His 143 yards from scrimmage made him a central component of Tennessee’s offensive success.
Hollins was the game’s biggest explosive receiver. His 158 yards and 60-yard catch kept Las Vegas dangerous.
The fourth quarter was almost entirely a Raiders comeback effort. Las Vegas scored nine points in the fourth, but the failed two-point conversion prevented the team from tying the game.
Turnovers were neutral. Each team threw one interception and neither lost a fumble.
Special teams mattered. Carlson was perfect on three field goals, while Stonehouse produced excellent punting numbers for Tennessee.
Frequently Asked Questions
What was the final score between the Titans and Raiders in 2022?
The Tennessee Titans defeated the Las Vegas Raiders 24-22 on September 25, 2022, at Nissan Stadium in Nashville.
Who had the most passing yards in the game?
Derek Carr led all passers with 303 yards on 26 completions from 44 attempts. Ryan Tannehill finished with 264 passing yards.
How many yards did Derrick Henry have?
Derrick Henry rushed for 85 yards on 20 carries and added 58 receiving yards on five catches, giving him 143 total yards from scrimmage.
Who led the Raiders in receiving?
Mack Hollins led the Raiders with eight receptions for 158 yards and one touchdown. His longest reception was 60 yards.
Who led the game in rushing?
Derrick Henry led the game in rushing yardage with 85 yards. Josh Jacobs led the Raiders with 66 rushing yards.
Why did the Titans win despite the Raiders gaining more yards?
The Raiders gained 396 total yards compared with Tennessee’s 361, but Tennessee built a 24-10 halftime lead. The Titans’ early scoring efficiency gave them enough of a cushion to survive Las Vegas’ 12-0 second-half advantage.
Conclusion
The Tennessee Titans vs Las Vegas Raiders match player stats from September 25, 2022 show how a close NFL game can be shaped by timing as much as by total production.
Las Vegas finished with more total yards, more first downs, and more passing yards. Derek Carr threw for 303 yards and two touchdowns, while Mack Hollins delivered 158 receiving yards. Josh Jacobs also averaged 5.1 yards per carry.
Tennessee, however, was more effective when the game was still being decided. Ryan Tannehill completed 19 of 27 passes for 264 yards and a 98.4 passer rating. Derrick Henry contributed 85 rushing yards, 58 receiving yards, and a rushing touchdown. Tennessee also received important production from Robert Woods, who averaged 21.3 yards per reception.
The biggest difference was the scoreboard after two quarters. Tennessee led 24-10 at halftime after scoring 17 points in the second quarter. Las Vegas fought back and scored 12 unanswered points after halftime, including a late touchdown from Hollins, but the failed two-point conversion left the Raiders two points short.
From an analytical perspective, this matchup is a strong example of why player statistics should be evaluated alongside game situation. Carr’s 303 passing yards were impressive, but they came in a game where Las Vegas was forced to chase a deficit. Tannehill’s lower passing volume was paired with greater efficiency and enough early scoring to put Tennessee in control.
The final 24-22 score therefore tells only part of the story. The individual numbers reveal a game defined by Tennessee’s early offensive efficiency, Henry’s all-around contribution, Hollins’ explosive receiving performance, and Las Vegas’ late but ultimately incomplete comeback.