Jacksonville Jaguars vs Tennessee Titans Match Player Stats
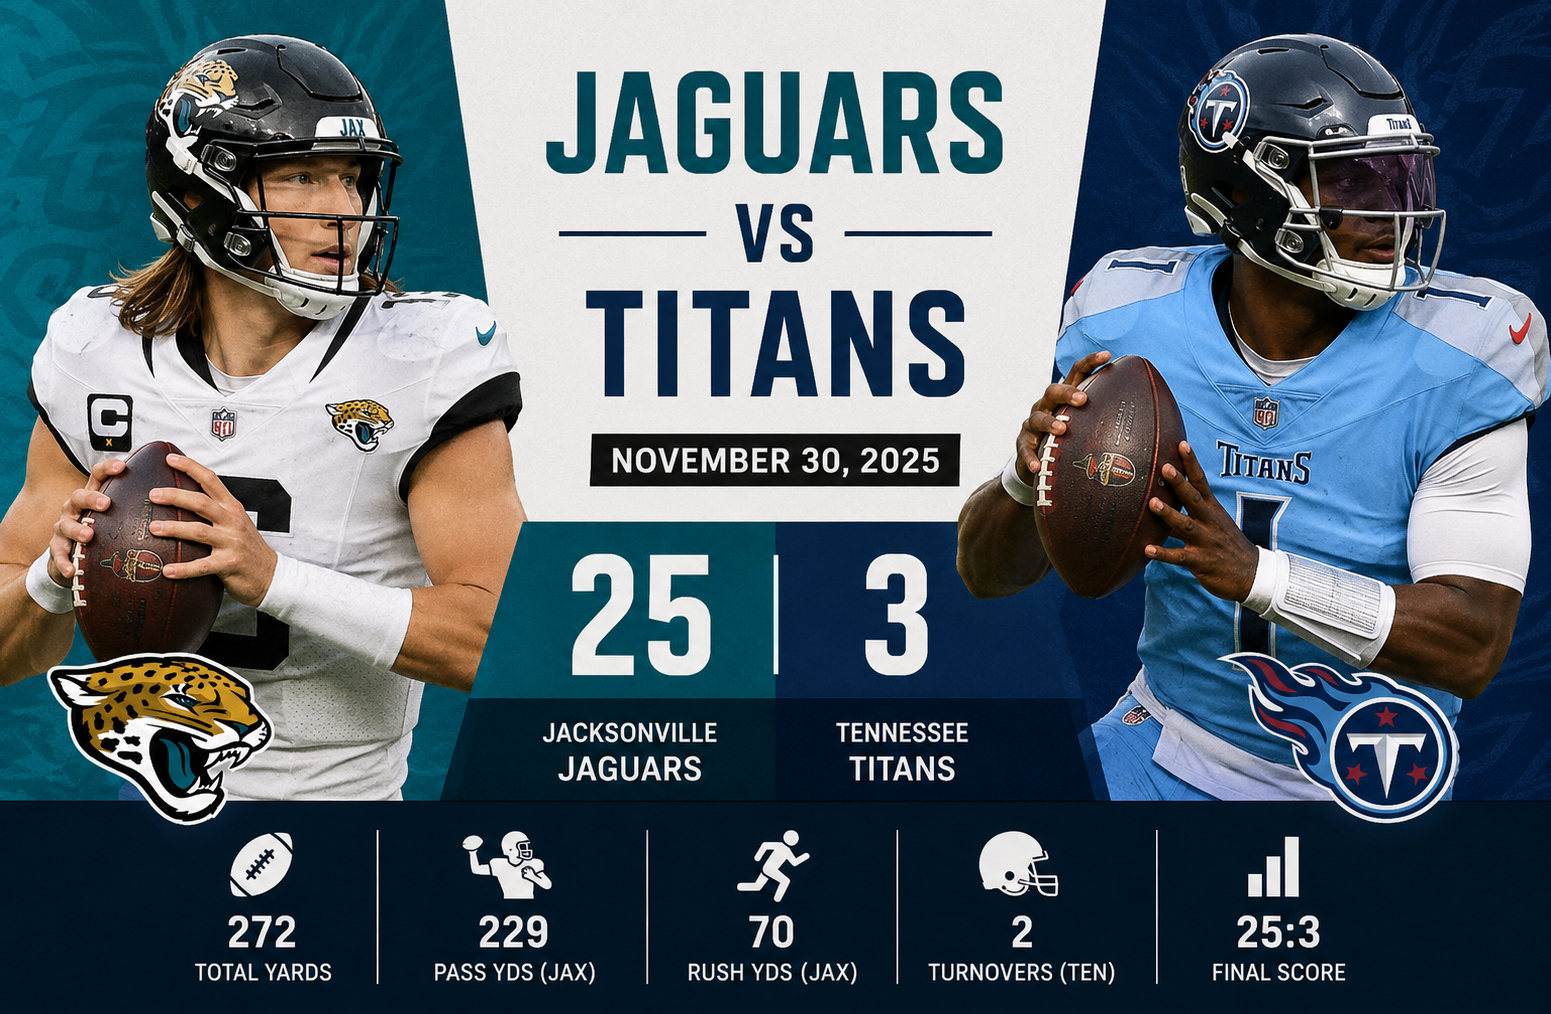
The jacksonville jaguars vs tennessee titans match player stats from November 30, 2025, tell a much clearer story than the 25-3 final score alone. Jacksonville controlled the game through efficient quarterback play, timely scoring, defensive pressure, and a major turnover advantage, while Tennessee struggled to create explosive offense for most of the afternoon. Trevor Lawrence completed 16 of 27 passes for 229 yards and two touchdowns without an interception, while Jakobi Meyers produced six receptions for 90 yards and a touchdown. On the other side, Cam Ward completed 24 of 38 passes for 141 yards with no touchdowns and no interceptions, but Tennessee’s offense remained limited by sacks, short completions, poor third-down production, and two lost fumbles.
The game was played at Nissan Stadium in Nashville, Tennessee, and Jacksonville entered the matchup at 8-4 overall and 4-2 on the road. Tennessee entered at 1-11 and 0-7 at home. Jacksonville eventually won 25-3, scoring in the first, second, and third quarters before shutting out the Titans in the fourth.
What makes this matchup particularly useful for statistical analysis is that Jacksonville did not need an overwhelming rushing performance to win comfortably. The Jaguars ran for only 70 yards, but Lawrence’s passing efficiency, Meyers’ receiving production, defensive pressure, and turnover-free football gave Jacksonville control. Tennessee actually averaged more yards per rushing attempt, yet still failed to sustain enough offense to challenge the Jaguars.
Game Overview
The final score was:
| Team | Q1 | Q2 | Q3 | Q4 | Final |
| Jacksonville Jaguars | 7 | 11 | 7 | 0 | 25 |
| Tennessee Titans | 3 | 0 | 0 | 0 | 3 |
Jacksonville’s 25 points came from three touchdowns, one field goal, and a successful two-point conversion. Tennessee’s only points came from Joey Slye’s 28-yard field goal in the opening quarter.
The Jaguars finished with 272 total yards compared with 188 for Tennessee. Jacksonville also recorded 20 first downs while the Titans managed only 11. Time of possession was relatively close, with Jacksonville holding the ball for 31:26 compared with Tennessee’s 28:34.
The biggest statistical differences were not simply about total yardage. Jacksonville protected the football, generated more productive passing plays, and repeatedly forced Tennessee into difficult situations.
The turnover margin was especially important. Jacksonville committed no turnovers, while Tennessee lost two fumbles. Neither team recorded an interception.
That combination gave Jacksonville a significant advantage without requiring a high-volume offensive explosion.
Jacksonville Jaguars vs Tennessee Titans Match Player Stats: Passing
Quarterback play was one of the clearest differences in the game.
Trevor Lawrence
Trevor Lawrence completed 16 of 27 passes for 229 yards, two touchdowns, and zero interceptions. He averaged 8.5 yards per completed pass attempt and finished with a 111.5 passer rating.
His official passing line was:
| Statistic | Trevor Lawrence |
| Completions | 16 |
| Attempts | 27 |
| Completion Rate | 59.3% |
| Passing Yards | 229 |
| Yards per Attempt | 8.5 |
| Touchdowns | 2 |
| Interceptions | 0 |
| Sacks | 3 |
| Sack Yards | 27 |
| Passer Rating | 111.5 |
| Long Pass | 50 yards |
The completion percentage was not spectacular by itself, but that number needs context. Lawrence averaged 8.5 yards per attempt and produced two touchdowns without turning the ball over.
That is an important distinction.
A quarterback can complete a high percentage of short throws without producing much offensive value. Lawrence’s performance was different because Jacksonville generated meaningful yardage from its passing game.
He also contributed 25 rushing yards on three carries, including a 14-yard run. His mobility helped Jacksonville overcome some negative plays and added another dimension to the offense.
Lawrence was sacked three times for 27 yards, so the passing performance was not flawless. Tennessee’s defensive front did find ways to pressure him. However, Jacksonville avoided the costly interceptions and fumbles that can quickly change a road game.
Cam Ward
Cam Ward completed 24 of 38 passes for 141 yards. He did not throw a touchdown or interception and finished with a 70.2 passer rating.
His statistical line was:
| Statistic | Cam Ward |
| Completions | 24 |
| Attempts | 38 |
| Completion Rate | 63.2% |
| Passing Yards | 141 |
| Yards per Attempt | 3.7 |
| Touchdowns | 0 |
| Interceptions | 0 |
| Sacks | 3 |
| Sack Yards | 20 |
| Passer Rating | 70.2 |
| Long Pass | 16 yards |
Ward’s completion percentage was actually higher than Lawrence’s. That fact can be misleading if viewed without the rest of the numbers.
Ward averaged only 3.7 yards per attempt. Tennessee completed many short passes but struggled to turn those completions into sustained offensive production.
The lack of explosive passing was one of the defining features of the Titans’ offensive performance.
Tennessee’s passing offense produced 121 net passing yards according to the game statistics, while Jacksonville produced 202 net passing yards. The difference came from both production and the effect of sacks.
Ward also faced a defense that consistently created pressure. Jacksonville recorded three sacks and five quarterback hits.
Rushing Performance
The rushing numbers provide an interesting contrast.
Jacksonville ran the football 27 times for 70 yards, averaging 2.6 yards per carry. Tennessee had 14 rushing attempts for 67 yards, averaging 4.8 yards per carry.
On a pure efficiency basis, Tennessee’s rushing attack was better.
Yet it did not translate into enough points.
Travis Etienne Jr.
Travis Etienne Jr. led Jacksonville in rushing attempts with 12. He gained 28 yards and averaged 2.3 yards per carry.
His longest run was six yards, and he did not score a touchdown.
| Player | Carries | Yards | Average | Long | TD |
| Travis Etienne Jr. | 12 | 28 | 2.3 | 6 | 0 |
Those numbers are modest, but they should not be interpreted as evidence that Jacksonville’s entire offensive approach failed on the ground.
The Jaguars were able to remain balanced enough to keep Tennessee’s defense honest while allowing Lawrence to create the larger gains through the air.
Bhayshul Tuten
Bhayshul Tuten provided Jacksonville’s rushing touchdown.
He carried the ball eight times for 17 yards and scored on a two-yard run in the third quarter. His touchdown completed a 15-play, 71-yard drive that consumed 6:36.
That drive was important because it demonstrated Jacksonville’s ability to control the game even after establishing a comfortable halftime lead.
Tony Pollard
Tony Pollard was Tennessee’s leading rusher.
He carried the ball 10 times for 60 yards, averaging 6.0 yards per carry. His longest run covered 15 yards.
| Player | Carries | Yards | Average | Long | TD |
| Tony Pollard | 10 | 60 | 6.0 | 15 | 0 |
Pollard’s numbers were one of the few statistical areas where Tennessee clearly performed well.
The problem was volume and game context.
Tennessee ran only 14 total rushing attempts. Once Jacksonville established a substantial lead, the Titans needed more efficient overall offensive possessions, but they could not consistently combine Pollard’s rushing success with passing production.
Receiving Leaders
The receiving statistics provide another strong explanation for the final result.
Jakobi Meyers
Jakobi Meyers was Jacksonville’s leading receiver and arguably the most important skill-position player in the game.
He caught six passes for 90 yards and a touchdown on six targets. His average was 15.0 yards per reception, and his longest catch went for 50 yards.
| Statistic | Jakobi Meyers |
| Targets | 6 |
| Receptions | 6 |
| Receiving Yards | 90 |
| Yards per Reception | 15.0 |
| Touchdowns | 1 |
| Long Reception | 50 yards |
Meyers’ six catches represented every target he received.
That perfect catch rate is particularly notable because he was also Jacksonville’s biggest source of explosive receiving production.
His 50-yard reception showed that Jacksonville could create chunk plays without needing a large number of passing attempts.
The touchdown came on a three-yard reception from Lawrence late in the first quarter. That score put Jacksonville ahead 7-3.
Meyers’ performance was especially significant because he had only recently joined Jacksonville after his time with the Las Vegas Raiders. His contribution in this matchup showed how quickly a reliable route runner can become useful in a quarterback’s passing structure.
Brenton Strange
Brenton Strange also made a meaningful contribution.
He recorded three receptions for 45 yards and a touchdown. His touchdown was a 21-yard reception from Lawrence early in the second quarter.
That play helped Jacksonville turn a narrow 7-3 lead into a much more comfortable advantage.
Tennessee Receiving Production
Chig Okonkwo led Tennessee’s receiving group with four receptions for 29 yards on five targets.
| Statistic | Chig Okonkwo |
| Targets | 5 |
| Receptions | 4 |
| Receiving Yards | 29 |
| Average | 7.3 |
| Touchdowns | 0 |
| Long Reception | 16 yards |
The contrast with Meyers was substantial.
Okonkwo’s four receptions were efficient from a catch-rate perspective, but Tennessee did not generate enough yardage after the catch or downfield production to threaten Jacksonville’s defense.
The Titans finished with 24 receptions for 141 receiving yards. Jacksonville had 16 receptions for 229 yards.
This is a useful reminder that more completions do not automatically mean a more effective passing attack.
Tennessee caught eight more passes than Jacksonville but gained 88 fewer receiving yards.
Defensive Player Stats
The defensive side of the jacksonville jaguars vs tennessee titans match player stats explains why Tennessee remained stuck at three points.
Jacksonville recorded 64 total tackles, 35 solo tackles, three sacks, four tackles for loss, three pass defenses, and five quarterback hits.
Tennessee recorded 55 total tackles, 32 solo tackles, three sacks, five tackles for loss, two pass defenses, and five quarterback hits.
Devin Lloyd
Devin Lloyd led Jacksonville with eight total tackles and five solo tackles.
His contribution reflected the Jaguars’ ability to keep Tennessee’s short passing and running plays from consistently turning into first downs.
Josh Hines-Allen
Josh Hines-Allen was Jacksonville’s standout pass rusher.
He recorded two sacks, three tackles for loss, and three quarterback hits.
His two sacks accounted for two of Jacksonville’s three sacks against Ward.
That pressure mattered because Tennessee’s offense already struggled to create explosive passing plays. Once Jacksonville forced Ward into obvious passing situations, the defense could attack more aggressively.
Tennessee’s Defensive Leaders
Cedric Gray led the Titans with nine total tackles and seven solo tackles.
Tennessee also recorded three sacks, with Kevin Winston Jr., Jeffery Simmons, and Cody Barton each registering one.
The Titans were therefore capable of creating pressure on Lawrence. The problem was that the defense could not consistently prevent Jacksonville from scoring.
A defense can generate sacks and still lose comfortably when the offense repeatedly fails to capitalize on possessions.
Turnovers and Hidden Yardage
One of the strongest indicators in this game was turnover differential.
Jacksonville:
- 0 fumbles
- 0 lost fumbles
- 2 fumble recoveries
- 0 interceptions thrown
Tennessee:
- 3 fumbles
- 2 lost fumbles
- 1 fumble recovery
- 0 interceptions thrown
The Jaguars did not simply avoid mistakes. They also benefited from Tennessee’s mistakes.
One of the key moments involved Jacksonville’s ability to create a turnover on special teams and turn it into points. The Jaguars’ official game report noted that rookie running back LeQuint Allen Jr. forced and recovered a fumble on a first-quarter kickoff return, setting up Jacksonville’s second-quarter scoring sequence.
This is the type of detail that a basic player-stat table can miss.
The final score was 25-3, but Jacksonville’s advantage came from several interconnected areas:
- Better passing efficiency.
- More explosive receiving plays.
- Zero turnovers.
- Two takeaways from Tennessee.
- Strong defensive pressure.
- Better third-down sustainability.
- More productive scoring drives.
Special Teams Statistics
Special teams also played a role.
Jacksonville
Cam Little made his only field-goal attempt from 45 yards and converted both extra-point attempts. He finished with five points.
Logan Cooke punted seven times for 313 yards, averaging 44.7 yards per punt. His longest punt traveled 63 yards, and one punt landed inside the 20-yard line.
Parker Washington returned one punt for 14 yards.
Jacksonville had two kickoff returns for 58 yards, averaging 29.0 yards per return.
Tennessee
Joey Slye made his only field-goal attempt, a 28-yard kick, which accounted for all three Tennessee points.
Johnny Hekker punted five times for 232 yards, averaging 46.4 yards. His longest punt was 57 yards, and he recorded one touchback.
Chimere Dike returned five punts for 76 yards, averaging 15.2 yards per return. His longest return was 47 yards.
Tennessee had three kickoff returns for 76 yards, averaging 25.3 yards per return.
The Titans’ punt-return numbers were actually useful, but they did not generate enough offensive conversion afterward.
How the Scoring Developed
The scoring sequence shows how quickly Jacksonville changed the game’s direction.
First Quarter
Tennessee opened the scoring with Joey Slye’s 28-yard field goal.
Jacksonville answered with a seven-play, 84-yard drive that ended with Meyers catching a three-yard touchdown pass from Lawrence.
The Jaguars finished the first quarter with a 7-3 lead.
Second Quarter
Jacksonville then created separation.
Lawrence connected with Brenton Strange for a 21-yard touchdown. Lawrence ran for the two-point conversion, making the score 15-3.
Jacksonville added another three points when Cam Little converted a 45-yard field goal as the second quarter ended.
The halftime score was 18-3.
That 11-point second quarter was critical because Tennessee never recovered.
Third Quarter
Jacksonville produced another long scoring drive.
The Jaguars moved 71 yards over 15 plays before Tuten scored on a two-yard rushing touchdown.
The score became 25-3.
From that point, Jacksonville did not need to chase additional points. The fourth quarter ended scoreless.
Why Jacksonville Won
The jacksonville jaguars vs tennessee titans match player stats reveal several specific reasons for Jacksonville’s victory.
1. Lawrence Created More Value Per Pass
Lawrence threw for 229 yards on 27 attempts.
Ward threw for 141 yards on 38 attempts.
The difference in passing efficiency was enormous.
Lawrence averaged 8.5 yards per attempt. Ward averaged 3.7.
Tennessee completed more passes, but Jacksonville produced much more yardage from fewer attempts.
2. Meyers Provided the Explosive Element
Meyers caught all six of his targets for 90 yards and a touchdown.
His 50-yard reception was particularly important because one explosive play can change the expected outcome of a drive.
Tennessee never produced a reception longer than 16 yards.
That difference explains much of the offensive gap.
3. Jacksonville Protected the Ball
The Jaguars finished without a turnover.
Tennessee lost two fumbles.
In a game where both teams failed to throw an interception, the fumble differential became even more significant.
4. Jacksonville’s Defense Limited Explosive Plays
Tennessee gained only 188 total yards.
The Titans produced 141 passing yards and 67 rushing yards.
More importantly, the passing attack rarely pushed the ball deep. Ward’s longest completion was only 16 yards.
5. The Jaguars Converted Opportunities Into Points
Jacksonville did not need a huge number of possessions.
It scored 25 points through efficient drives and avoided giving Tennessee easy short fields through turnovers.
That combination produced a comfortable road victory.
What the Numbers Say About Trevor Lawrence
It would be easy to summarize Lawrence’s performance as simply “229 yards and two touchdowns,” but the deeper interpretation is more useful.
His 111.5 passer rating came from a combination of efficient yardage, two touchdown passes, and no interceptions.
He also averaged 8.5 yards per attempt.
At the same time, three sacks for 27 yards show that Jacksonville’s offensive line and passing protection were not perfect.
The most important point is that Lawrence did not need to throw 40 or 45 passes.
He attempted only 27.
Jacksonville’s offense therefore operated efficiently rather than relying on volume.
That is often a positive sign for a team trying to win games late in the season because it reduces unnecessary exposure to turnovers.
What the Numbers Say About Cam Ward
Ward’s performance was more difficult to evaluate through completion percentage alone.
He completed 63.2 percent of his passes, which sounds respectable.
But 24 completions produced only 141 yards.
That means Tennessee repeatedly completed short throws without turning them into major gains.
His 3.7 yards per attempt is the key number.
Ward also failed to produce a touchdown, and the Titans finished with only 11 first downs.
The three sacks did not help, but the larger issue was the lack of sustained offensive efficiency.
The Rushing Paradox
One of the most interesting statistical details is that Tennessee averaged 4.8 yards per rush while Jacksonville averaged only 2.6.
Yet Jacksonville won 25-3.
This illustrates why rushing average cannot be evaluated in isolation.
Tennessee’s 67 rushing yards came on only 14 attempts. Pollard was effective, but Tennessee did not run the ball often enough to make that efficiency the foundation of the offense.
Jacksonville’s 70 rushing yards came on 27 attempts.
The Jaguars therefore used the run more frequently even though each individual carry produced fewer yards.
The difference was game control.
Jacksonville did not need to dominate rushing efficiency. It needed enough rushing production to support Lawrence and protect its lead.
A Closer Look at Team Efficiency
| Category | Jaguars | Titans |
| Total Yards | 272 | 188 |
| Passing Yards | 229 | 141 |
| Rushing Yards | 70 | 67 |
| Total Plays | 57 | 55 |
| Yards per Play | 4.8 | 3.4 |
| First Downs | 20 | 11 |
| Turnovers Lost | 0 | 2 |
| Time of Possession | 31:26 | 28:34 |
| Sacks Allowed | 3 | 3 |
The most revealing numbers are total yards, first downs, yards per play, and turnovers.
Jacksonville averaged 4.8 yards per play compared with 3.4 for Tennessee.
That difference may appear small, but across dozens of plays it becomes substantial.
Jacksonville also produced nine more first downs.
That helped the Jaguars sustain drives and kept Tennessee’s offense off the field.
What Tennessee Could Have Done Differently
The Titans’ statistical profile suggests several areas that needed improvement.
First, Tennessee needed more explosive passing plays. A passing attack averaging only 3.7 yards per attempt is difficult to sustain against a defense that can generate pressure.
Second, the Titans needed to avoid turnovers. Two lost fumbles gave Jacksonville valuable opportunities.
Third, Tennessee needed more offensive balance. Pollard averaged 6.0 yards per carry, yet the Titans ran only 14 times.
Fourth, third-down efficiency needed improvement. Tennessee converted only 2 of 12 third-down attempts, according to the postgame statistical report.
That number is particularly damaging because it limits possession time and prevents otherwise promising drives from becoming scoring opportunities.
The Titans also went 1-for-4 on fourth down.
When a team struggles on third down and then cannot consistently convert fourth downs, offensive possessions become very difficult to sustain.
What Jacksonville Could Improve
A 25-3 road victory does not mean Jacksonville played a perfect game.
The Jaguars rushed for only 70 yards on 27 attempts.
Etienne averaged just 2.3 yards per carry.
Lawrence was also sacked three times.
Those are areas Jacksonville would want to examine before facing stronger opponents.
The difference is that Jacksonville’s mistakes did not become catastrophic.
The offense protected the football, generated explosive passes, and scored enough points early to make the later stages manageable.
That is often the profile of a mature team: not perfection, but control.
Most Important Player Performances
Based strictly on the available game statistics, several players stand out.
Trevor Lawrence
Lawrence was the central offensive figure with 229 passing yards, two touchdowns, and no interceptions.
Jakobi Meyers
Meyers produced six catches for 90 yards and one touchdown, including a 50-yard reception.
Brenton Strange
Strange added three receptions for 45 yards and a touchdown.
Josh Hines-Allen
Hines-Allen recorded two sacks, three tackles for loss, and three quarterback hits.
Devin Lloyd
Lloyd led Jacksonville with eight total tackles.
Tony Pollard
Pollard was Tennessee’s most productive runner, gaining 60 yards on 10 carries.
Cedric Gray
Gray led Tennessee with nine tackles, including seven solo stops.
Statistical Takeaways for Fantasy Football Analysis
Although this was a single-game performance and should not be treated as a full-season projection, several fantasy-relevant observations emerge.
Lawrence’s two touchdown passes and 229 passing yards made him the most productive quarterback from the matchup.
Meyers was particularly notable because he combined a perfect six-for-six receiving line with 90 yards and a touchdown.
Etienne’s rushing production was much less impressive, with only 28 yards on 12 carries.
Pollard was efficient on the ground, but his 10 carries limited his overall rushing volume.
For defensive fantasy scoring, Hines-Allen’s two sacks made him one of the most impactful individual defenders in the game.
The important lesson is to separate volume from efficiency. A player can have a strong average but limited opportunities, while another player can have high volume but low efficiency.
Frequently Asked Questions
What was the final score between the Jaguars and Titans?
The Jacksonville Jaguars defeated the Tennessee Titans 25-3 on November 30, 2025, at Nissan Stadium.
Who was the leading passer in the game?
Trevor Lawrence led all passers with 16 completions on 27 attempts for 229 yards and two touchdowns. He threw no interceptions and finished with a 111.5 passer rating.
Who led the Jaguars in receiving?
Jakobi Meyers led Jacksonville with six receptions for 90 yards and one touchdown. His longest reception was 50 yards.
Who led the Titans in rushing?
Tony Pollard led Tennessee with 10 carries for 60 yards, averaging 6.0 yards per carry.
Who recorded the most sacks?
Josh Hines-Allen led the game with two sacks for Jacksonville. The Jaguars recorded three sacks as a team, while Tennessee also recorded three sacks.
How many turnovers did each team have?
Jacksonville committed zero turnovers, while Tennessee lost two fumbles. Neither team threw an interception.
Conclusion
The jacksonville jaguars vs tennessee titans match player stats from November 30, 2025, show a Jacksonville team that won through efficiency, discipline, and timely execution rather than overwhelming rushing production.
Trevor Lawrence’s 229 passing yards and two touchdowns gave Jacksonville the offensive foundation. Jakobi Meyers supplied the biggest receiving impact with 90 yards and a touchdown, while Brenton Strange added another touchdown through the air.
On defense, Josh Hines-Allen’s two sacks helped Jacksonville limit Cam Ward and a Tennessee passing attack that finished with only 141 passing yards. Devin Lloyd led the Jaguars in tackles, while the defense as a whole held Tennessee to 188 total yards and three points.
The Titans had some positive individual numbers, particularly Tony Pollard’s 60 rushing yards on 10 carries and Cedric Gray’s nine tackles. However, those performances could not compensate for the team’s limited passing efficiency, two lost fumbles, and poor third-down results.
The biggest statistical lesson from the matchup is that individual efficiency must be viewed within the context of the entire game. Tennessee averaged 4.8 yards per rushing attempt, but Jacksonville still controlled the contest because it generated more passing value, more first downs, more total yardage, and a decisive turnover advantage.
Jacksonville’s 25-3 victory was therefore not simply a result of one star player. It was the product of complementary football. The quarterback protected the ball, the receivers created explosive gains, the defense generated pressure, and the team converted opportunities into points.
That combination explains why the Jaguars left Nashville with a convincing road victory and an 8-4 record, while the Titans fell to 1-11.