New Orleans Pelicans vs Dallas Mavericks Match Player Stats
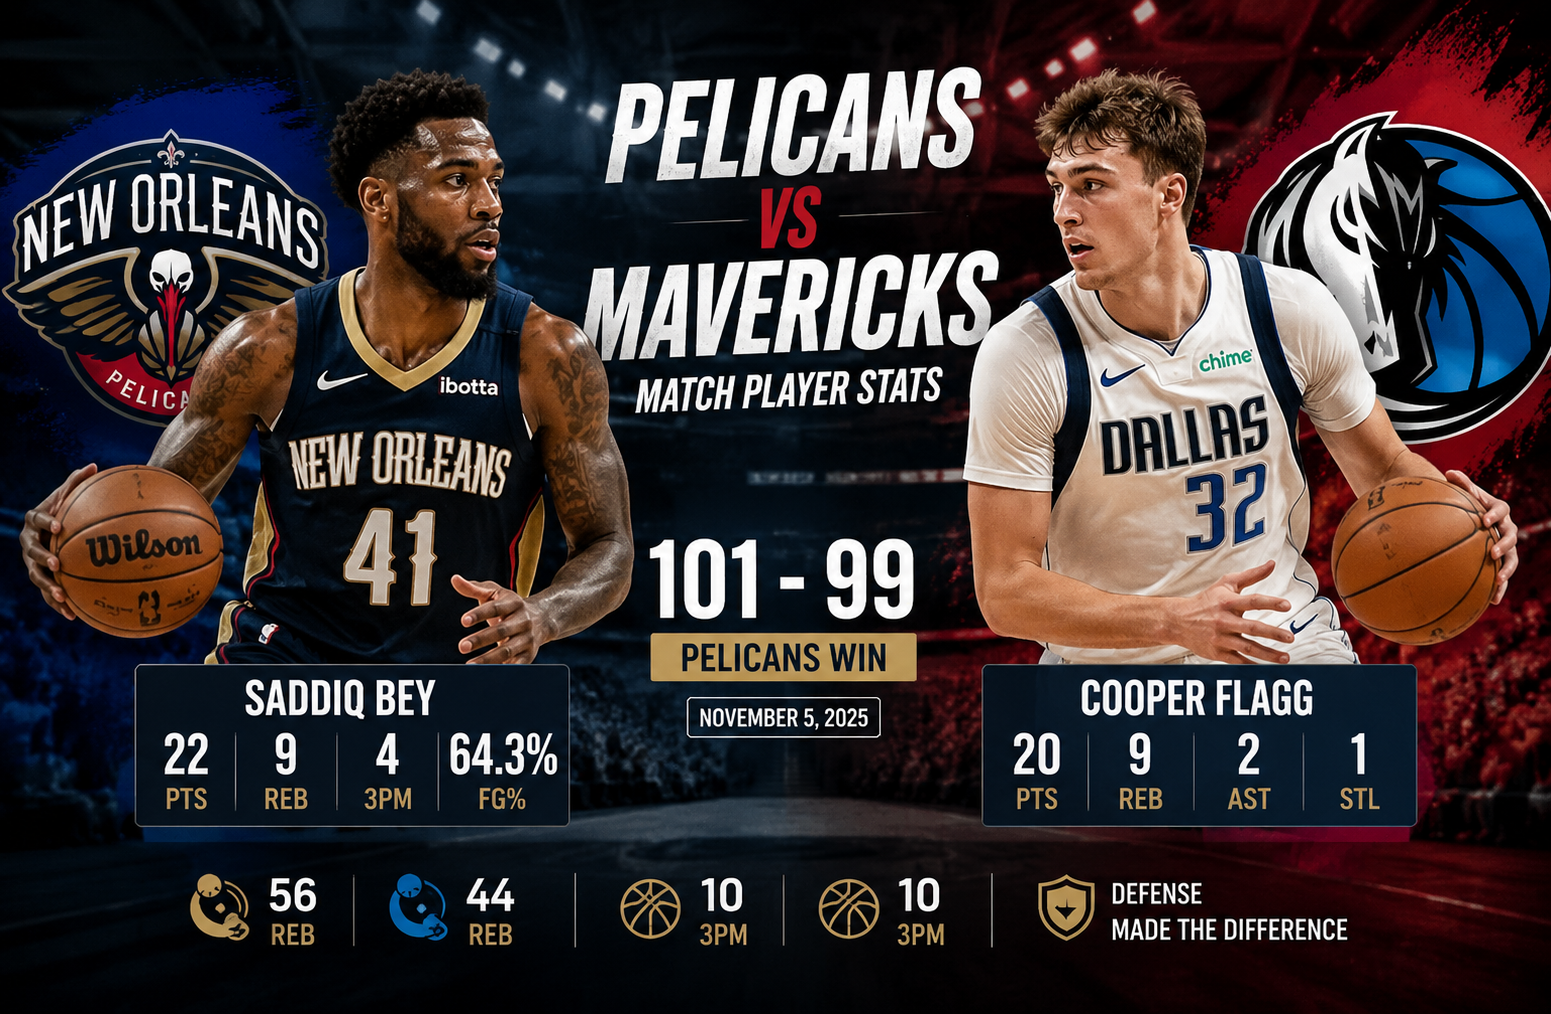
The new orleans pelicans vs dallas mavericks match player stats from the Pelicans’ 101-99 victory over the Mavericks provide a clear picture of how a tightly contested NBA game was decided by rebounding, efficient individual scoring, and timely defensive plays. Saddiq Bey led New Orleans with 22 points and nine rebounds, while rookie Cooper Flagg paced Dallas with 20 points and nine rebounds. The game was decided in the final seconds after Dallas rallied from a double-digit deficit, but New Orleans held on at American Airlines Center.
For readers looking beyond the final score, this game is especially interesting because the basic shooting numbers were remarkably close. New Orleans shot 42.9% from the field compared with Dallas at 41.6%, while both teams made 10 three-pointers. The biggest statistical difference came on the glass, where the Pelicans finished with 56 rebounds compared with 44 for the Mavericks. That 12-rebound advantage helped New Orleans survive Dallas’ late comeback and secure a two-point road victory.
New Orleans Pelicans vs Dallas Mavericks Match Player Stats
The game was played at American Airlines Center in Dallas. NBA’s official game record lists the matchup as November 5, 2025, while the game information also displays November 6 in the early-hours local presentation. The official NBA box score confirms the final score as New Orleans 101, Dallas 99.
Final score and quarter breakdown
| Quarter | Pelicans | Mavericks |
| 1st | 29 | 19 |
| 2nd | 23 | 30 |
| 3rd | 26 | 28 |
| 4th | 23 | 22 |
| Final | 101 | 99 |
New Orleans established control early by winning the opening quarter 29-19. Dallas responded with a 30-point second quarter and then edged New Orleans 28-26 in the third. The Mavericks entered the fourth quarter only two points behind, creating a genuine one-possession finish.
That pattern matters when evaluating the player statistics. The Pelicans did not dominate the entire game. They built an early cushion, watched Dallas steadily erase much of it, and then relied on enough defensive resistance and rebounding to protect a narrow lead.
The official game record also shows that Dallas led at times by as many as five points, while New Orleans’ largest lead was 13. There were four ties and eight lead changes, which reinforces how competitive the contest became after the Pelicans’ early advantage.
Pelicans Player Stats and Individual Performances
Saddiq Bey was the headline performer for New Orleans. He finished with 22 points on 9-of-14 shooting, including 4-of-6 from three-point range. He also collected nine rebounds and finished with a respectable 64.3% field-goal percentage.
His scoring efficiency was one of the most important elements of the game. Bey did not need a large number of attempts to become New Orleans’ leading scorer. His four made three-pointers also gave the Pelicans valuable perimeter production in a game where neither team generated overwhelming shooting efficiency.
Saddiq Bey
- 30 minutes
- 22 points
- 9-of-14 field goals
- 4-of-6 three-pointers
- 9 rebounds
- 1 assist
- 1 turnover
- Plus/minus: -1
Bey’s plus/minus of -1 is a useful reminder that box-score leadership and overall lineup impact are not always identical. He was clearly New Orleans’ best scorer, but his individual plus/minus was slightly negative in a game the Pelicans won.
Trey Murphy III
Trey Murphy III played 38 minutes and contributed in several categories despite struggling as a shooter.
He finished with 11 points on 3-of-12 shooting and made only one of six attempts from three-point range. However, his overall contribution was much broader than his scoring line.
Murphy recorded:
- 9 rebounds
- 5 assists
- 2 steals
- 1 block
- 3 turnovers
- 11 points
His five assists were a team high, and his nine rebounds tied Bey for the Pelicans’ best total. This is an important example of why player analysis should not focus solely on points.
Murphy’s +1 also indicates that New Orleans remained slightly ahead during his minutes despite his inefficient shooting. His ability to rebound, facilitate and defend helped offset the lack of perimeter scoring.
Herbert Jones
Herbert Jones delivered one of the strongest all-around performances on the Pelicans roster.
He scored 12 points on 6-of-10 shooting, grabbed five rebounds, recorded two assists and produced two steals and one block. Most importantly, he finished with a team-best plus/minus of +10 among the players listed in the supplied statistics.
Jones’ 60% field-goal shooting was also among New Orleans’ most efficient performances. He did not rely on three-point volume to contribute. Instead, he made six of his 10 field-goal attempts and added defensive activity.
For readers analyzing the game beyond the leading scorer, Jones is arguably one of the most important players to study.
Jose Alvarado
Jose Alvarado provided one of New Orleans’ biggest efficiency boosts off the bench.
He scored 13 points in 23 minutes while shooting 4-of-8 from the field and an impressive 3-of-5 from three-point range. He also grabbed eight rebounds and finished with a team-best +12.
His line was:
- 13 points
- 4-of-8 FG
- 3-of-5 3PT
- 2-of-2 FT
- 8 rebounds
- 2 assists
- 1 turnover
- +12
The combination of scoring efficiency, rebounding and positive plus/minus makes Alvarado particularly notable. He played fewer minutes than Murphy but still had a substantial influence on the game.
Jeremiah Fears
Jeremiah Fears scored 13 points, matching Alvarado’s total, but his efficiency was much lower.
He shot 5-of-15 from the field and 1-of-6 from three-point range. He added five rebounds and three assists but also committed three turnovers.
His final line included:
- 13 points
- 5-of-15 FG
- 1-of-6 3PT
- 2-of-2 FT
- 5 rebounds
- 3 assists
- 3 turnovers
- 1 steal
- -10
The -10 plus/minus was the weakest among New Orleans’ principal contributors. This does not mean Fears played poorly in every aspect, but it does show that the Pelicans’ most successful stretches came through other combinations.
Derik Queen
Derik Queen added 11 points and seven rebounds in 26 minutes.
He shot 3-of-8 from the field and 5-of-7 at the free-throw line. His three steals were particularly valuable from a defensive standpoint.
Queen’s stat line shows how free throws can compensate for inefficient field shooting. He made only three field goals but still reached double figures because he converted five free throws.
Other Pelicans contributors
Kevon Looney scored eight points and grabbed six rebounds in 15 minutes. He also recorded two assists and one block while committing no turnovers.
Jordan Hawkins scored nine points but shot 4-of-13 overall and 1-of-4 from three-point range. His two steals provided some defensive value.
Karlo Matkovic played 10 minutes and finished with two points and two rebounds.
Micah Peavy did not score, going 0-of-1 from the field, but he grabbed three rebounds in 18 minutes.
The combined performance shows that New Orleans received useful contributions from several rotation players rather than depending entirely on one scorer.
Mavericks Player Stats and Individual Performances
Dallas had its own standout performers, led by Cooper Flagg.
Flagg scored 20 points, becoming the Mavericks’ leading scorer in the game. He shot 8-of-19 from the field, made one of five three-point attempts and converted all three of his free throws.
He also recorded nine rebounds, two assists, three steals and two blocks.
Cooper Flagg
Flagg’s final statistical line was:
- 20 points
- 8-of-19 FG
- 1-of-5 3PT
- 3-of-3 FT
- 9 rebounds
- 2 assists
- 3 steals
- 2 blocks
- 2 turnovers
- +1
The defensive numbers stand out. Three steals and two blocks gave Flagg a substantial presence beyond scoring.
His 20 points also represented a milestone in the context of the game because Dallas was dealing with significant lineup changes and absences. The official recap noted that Flagg moved from point guard to small forward, while D’Angelo Russell made his first start of the season at point guard.
The final possession also became part of the story. Flagg had a potential game-tying shot with two seconds remaining, but the attempt hit the back of the rim and Murphy secured the contested rebound.
P.J. Washington
P.J. Washington produced Dallas‘ best rebounding performance.
He scored 15 points and grabbed 11 rebounds, giving him a double-double. He shot 5-of-13 from the field, 1-of-3 from three and 4-of-7 at the free-throw line.
His four turnovers were a drawback, but his work on the boards was important for a Dallas team that ultimately lost the overall rebounding battle.
Daniel Gafford
Daniel Gafford was highly efficient.
He scored 15 points on 6-of-8 shooting and made all three of his free throws. He also grabbed eight rebounds, recorded two steals and blocked two shots.
His 75% field-goal shooting was one of the most efficient high-volume performances in the game.
Gafford’s eight rebounds were particularly important because Dallas needed more second-chance opportunities. However, despite his efficient scoring, the Mavericks could not turn that production into enough total offense.
Klay Thompson
Klay Thompson came off the bench and scored 11 points in 21 minutes.
He shot 4-of-7 from the field and made 3-of-6 three-point attempts. His four rebounds and three assists gave him additional value.
The three made three-pointers were especially useful because Dallas finished with 10 made threes overall.
The official game recap noted that Thompson came off the bench for the first time since March 2024 during his final season with Golden State and matched his season high with 11 points.
Max Christie
Max Christie scored 12 points in 27 minutes.
He shot 5-of-12 from the field and 2-of-6 from three. He also recorded three rebounds and one steal without committing a turnover.
That zero-turnover performance stands out because Dallas committed 15 turnovers as a team.
Brandon Williams
Brandon Williams contributed 10 points, three assists and two steals in 19 minutes.
He shot 4-of-9 from the field and made one of three three-point attempts.
His +6 plus/minus was one of Dallas’ better individual figures, suggesting that his minutes were relatively productive even though the Mavericks did not win the game.
Caleb Martin and D’Angelo Russell
Caleb Martin finished with seven points, five rebounds and five assists. His five assists tied the team high, but he shot only 2-of-5 from the field and finished at -10.
D’Angelo Russell scored nine points in 21 minutes while shooting 3-of-10 from the field. He made two of four three-point attempts and added three assists.
The official recap specifically noted that Russell started at point guard and scored nine points on 3-of-10 shooting.
Team Statistics That Decided the Game
The most useful way to understand this matchup is to compare the team totals rather than looking only at the leading scorers.
| Statistic | Pelicans | Mavericks |
| Points | 101 | 99 |
| Field Goals | 39-91 | 37-89 |
| Field-Goal % | 42.9% | 41.6% |
| 3-Pointers | 10-31 | 10-32 |
| Three-Point % | 32.3% | 31.3% |
| Free Throws | 13-16 | 15-20 |
| Free-Throw % | 81.3% | 75.0% |
| Rebounds | 56 | 44 |
| Assists | 18 | 18 |
| Turnovers | 13 | 15 |
| Steals | 10 | 11 |
| Blocks | 3 | 7 |
The official NBA box score confirms New Orleans’ 39-of-91 shooting, 10-of-31 three-point shooting, 13-of-16 free throws and 56 rebounds. Dallas finished 37-of-89 from the field, 10-of-32 from three, 15-of-20 at the line and 44 rebounds.
Rebounding was the clearest difference
The 56-44 rebounding margin is arguably the most important statistical advantage in the game.
New Orleans collected 12 more rebounds than Dallas. Trey Murphy III and Saddiq Bey each had nine, while Jose Alvarado added eight and Kevon Looney six.
Dallas had strong individual rebounding numbers from Washington, Flagg and Gafford, but the team still lost the overall battle.
Interestingly, the Mavericks won the second-chance-points category 18-10 according to the official game summary. That means the Pelicans’ rebounding advantage did not automatically translate into more second-chance scoring.
This is an important analytical distinction. Rebounding volume and second-chance efficiency are separate concepts.
Shooting was close
New Orleans shot 42.9% while Dallas shot 41.6%.
That is a difference of only 1.3 percentage points.
The three-point numbers were even closer. Both teams made 10 threes, with New Orleans taking 31 attempts and Dallas taking 32.
The difference came in three-point percentage:
- Pelicans: 32.3%
- Mavericks: 31.3%
Neither team was dominant from beyond the arc, so the game was decided by several smaller advantages rather than one overwhelming shooting edge.
Free throws favored New Orleans in efficiency
Dallas attempted four more free throws than New Orleans.
The Mavericks went 15-of-20, while the Pelicans went 13-of-16.
However, New Orleans converted 81.3% of its free throws compared with Dallas’ 75%.
In a two-point game, those small efficiency differences matter.
Turnovers and Possession Management
The Pelicans committed 13 turnovers compared with 15 by Dallas.
The difference is not enormous, but it favored New Orleans.
The official game summary also shows Dallas produced 18 fast-break points compared with New Orleans’ 16, while New Orleans scored 54 points in the paint compared with Dallas’ 50.
This gives a more nuanced picture of the contest.
Dallas generated slightly more transition scoring, but New Orleans had the edge inside. The Pelicans also limited their turnovers enough to prevent Dallas from gaining a major possession advantage.
For a game decided by two points, those small margins collectively become important.
Why Saddiq Bey Was the Offensive Difference-Maker
Bey’s 22 points were the highest individual total in the game.
What makes the performance more impressive is the efficiency.
He scored 22 points from 14 field-goal attempts, making nine. Four of those makes came from three-point range.
That means Bey combined volume with accuracy without requiring a large number of possessions.
His nine rebounds also made him part of the solution to New Orleans’ biggest team advantage.
This is a useful lesson when evaluating player statistics. A 22-point performance is more valuable when it arrives alongside efficient shooting and strong rebounding.
Why Cooper Flagg Still Had a Major Impact
Flagg’s 20-point performance deserves attention even though Dallas lost.
He led the Mavericks in scoring and finished just one rebound short of a double-double. His three steals and two blocks also demonstrate his two-way involvement.
His shooting was not perfect. The 8-of-19 field-goal line shows that he needed 19 attempts to reach 20 points, and he made only one of five three-point attempts.
Still, his ability to contribute in multiple statistical categories kept Dallas competitive.
The final missed shot should also not erase the broader performance. NBA games are decided by hundreds of possessions, not a single final attempt.
The Role of Defense in a Two-Point Game
New Orleans recorded 10 steals and three blocks.
Dallas recorded 11 steals and seven blocks.
On paper, Dallas had the superior rim-protection total because of its seven blocks. Yet New Orleans still scored 54 points in the paint.
That tells us that blocks alone do not define interior defense.
The Pelicans were able to create enough interior scoring opportunities despite Dallas’ shot-blocking presence. At the same time, New Orleans’ 10 steals helped generate defensive pressure without relying entirely on blocked shots.
Herbert Jones was particularly important here because he combined efficient scoring with two steals and a block.
The Fourth Quarter and Final Possession
The fourth quarter was a defensive battle.
New Orleans scored 23 points while Dallas scored 22.
Neither team produced a decisive late offensive run.
That is exactly why the final possession mattered so much.
Dallas had a chance to tie the game after trailing for much of the contest, but Flagg’s running shot with two seconds left hit the back of the rim. Murphy grabbed the contested rebound to end the threat.
For anyone studying new orleans pelicans vs dallas mavericks match player stats, this final sequence is important because it connects the raw numbers to the actual outcome. Murphy’s nine rebounds were not simply a box-score achievement. His final rebound directly helped close the game.
Lineup Context Matters
The statistics become easier to understand when the lineup situation is considered.
The Pelicans entered the game using their seventh starting lineup in eight games. They were also without Zion Williamson and Jordan Poole, according to the official recap.
Dallas had its own major absences. Anthony Davis missed his third consecutive game with a calf strain, while Dereck Lively II was unavailable for a fifth consecutive game because of a knee sprain.
Those absences help explain why the game featured unusual roles.
Dallas changed its starting lineup, moving Flagg from point guard to small forward and starting Russell at point guard. Thompson also moved into a bench role.
This context matters because player statistics cannot always be interpreted as though every game occurs under identical conditions.
Advanced Reading of the Box Score
A deeper reading of the numbers reveals several useful patterns.
New Orleans won without elite shooting
The Pelicans did not shoot at a spectacular level.
They made only 39 of 91 field-goal attempts.
They also missed 21 of their 31 three-point attempts.
Yet they still won.
That demonstrates the importance of complementary statistics. Rebounding, free-throw accuracy, turnover control and defensive activity compensated for the shooting limitations.
Dallas had more blocks but still lost the interior battle
Seven blocks is a strong defensive number.
However, New Orleans scored 54 points in the paint.
This demonstrates why one defensive category should not be evaluated in isolation.
Bench contributions mattered
Alvarado scored 13 points and produced a +12 rating.
Thompson scored 11 points for Dallas, while Brandon Williams added 10.
The game therefore featured meaningful reserve contributions from both sides.
The difference was that New Orleans received particularly efficient production from Alvarado, who made three of five three-point attempts and four of eight shots overall.
Most Important Player Stats at a Glance
Pelicans leaders
Points: Saddiq Bey, 22
Rebounds: Trey Murphy III and Saddiq Bey, 9 each
Assists: Trey Murphy III, 5
Steals: Derik Queen, 3
Blocks: Multiple players, 1 each
Best listed plus/minus: Jose Alvarado, +12
Mavericks leaders
Points: Cooper Flagg, 20
Rebounds: P.J. Washington, 11
Assists: Caleb Martin, 5
Steals: Cooper Flagg, 3
Blocks: Multiple players, including Flagg, Washington and Gafford
Best listed plus/minus: Brandon Williams, +6
The official NBA game pages confirm Bey as New Orleans’ scoring leader and Flagg as Dallas’ scoring leader, with Murphy leading the Pelicans in rebounding and assists and Washington leading Dallas in rebounding.
What the Result Meant for Both Teams
The victory moved New Orleans to 2-6 overall and 1-4 on the road according to the supplied game data.
Dallas also entered the game at 2-6 but fell after the defeat, extending its losing streak to three games according to the official recap.
The result was therefore valuable for New Orleans beyond the single game.
For Dallas, the loss highlighted the difficulty of overcoming missing frontcourt players while simultaneously integrating a new lineup structure.
A Practical Way to Read NBA Player Stats
If you are using this game as a reference for future matchups, a useful approach is to evaluate player statistics in five stages.
1. Start with scoring efficiency
Look at field-goal percentage, three-point percentage and free-throw efficiency before judging a scoring total.
Bey’s 22 points on 9-of-14 shooting are a good example of efficient scoring.
2. Check rebounding next
Rebounds often reveal which team controlled extra possessions.
New Orleans’ 56 rebounds compared with Dallas’ 44 were a major part of this game’s statistical story.
3. Evaluate playmaking and turnovers together
Assists show creation, but turnovers show the cost of that creation.
Murphy had five assists and three turnovers. Martin had five assists and one turnover.
That difference provides additional context that a simple assists ranking does not.
4. Look at defensive events
Steals and blocks can show disruptive defensive activity, but they should be combined with the broader team context.
Dallas had seven blocks, yet New Orleans scored 54 points in the paint.
5. Use plus/minus carefully
Plus/minus can identify successful lineup stretches, but it should never be treated as a standalone player grade.
Alvarado’s +12 was excellent, while Fears’ -10 was comparatively poor. Those numbers become more meaningful when considered alongside their shooting, rebounding, turnovers and defensive contributions.
FAQs
Who led the Pelicans in scoring against the Mavericks?
Saddiq Bey led New Orleans with 22 points. He shot 9-of-14 from the field and made four three-pointers.
Who led the Mavericks in scoring?
Cooper Flagg led Dallas with 20 points. He also recorded nine rebounds, three steals and two blocks.
What was the final score of the Pelicans vs Mavericks game?
New Orleans defeated Dallas 101-99.
Which team had more rebounds?
The Pelicans had 56 rebounds, while the Mavericks had 44. New Orleans therefore held a 12-rebound advantage.
Who had the most assists?
Trey Murphy III led New Orleans with five assists. Caleb Martin led Dallas with five assists.
What was the biggest statistical difference in the game?
The clearest team-level difference was rebounding. New Orleans finished with 56 rebounds compared with 44 for Dallas. Shooting percentages were relatively close.
Conclusion
The new orleans pelicans vs dallas mavericks match player stats tell the story of a game that was much closer than the early scoreboard suggested.
New Orleans won 101-99 after taking a 29-19 first-quarter lead and then surviving Dallas’ sustained comeback. Saddiq Bey supplied the headline scoring performance with 22 points and nine rebounds, while Trey Murphy III contributed nine rebounds and five assists despite an inefficient shooting night. Herbert Jones added efficient scoring and defensive activity, while Jose Alvarado delivered one of the strongest bench performances with 13 points and a +12 plus/minus.
Dallas received a strong two-way performance from Cooper Flagg, who scored 20 points and added nine rebounds, three steals and two blocks. P.J. Washington posted 15 points and 11 rebounds, while Daniel Gafford scored 15 points on 6-of-8 shooting. Klay Thompson also provided useful perimeter scoring from the bench.
The team numbers explain why those individual performances produced such a narrow result. The Pelicans and Mavericks were close in field-goal percentage and made the same number of three-pointers. Dallas actually had more blocks and slightly more fast-break points. New Orleans, however, controlled the overall rebounding battle by 12 and committed two fewer turnovers.
The final possession ultimately reflected the broader statistical story. Flagg had an opportunity to tie the game, but the shot missed and Murphy secured the decisive rebound. In a two-point contest, a single rebound can become the difference between a road victory and a heartbreaking loss.
For anyone analyzing NBA box scores, this matchup is a strong reminder that the leading scorer is only one part of the story. Efficiency, rebounding, defensive activity, turnovers, lineup context and late-game execution all help explain why the Pelicans walked out of Dallas with the win.