Charlotte Hornets vs Milwaukee Bucks Match Player Stats
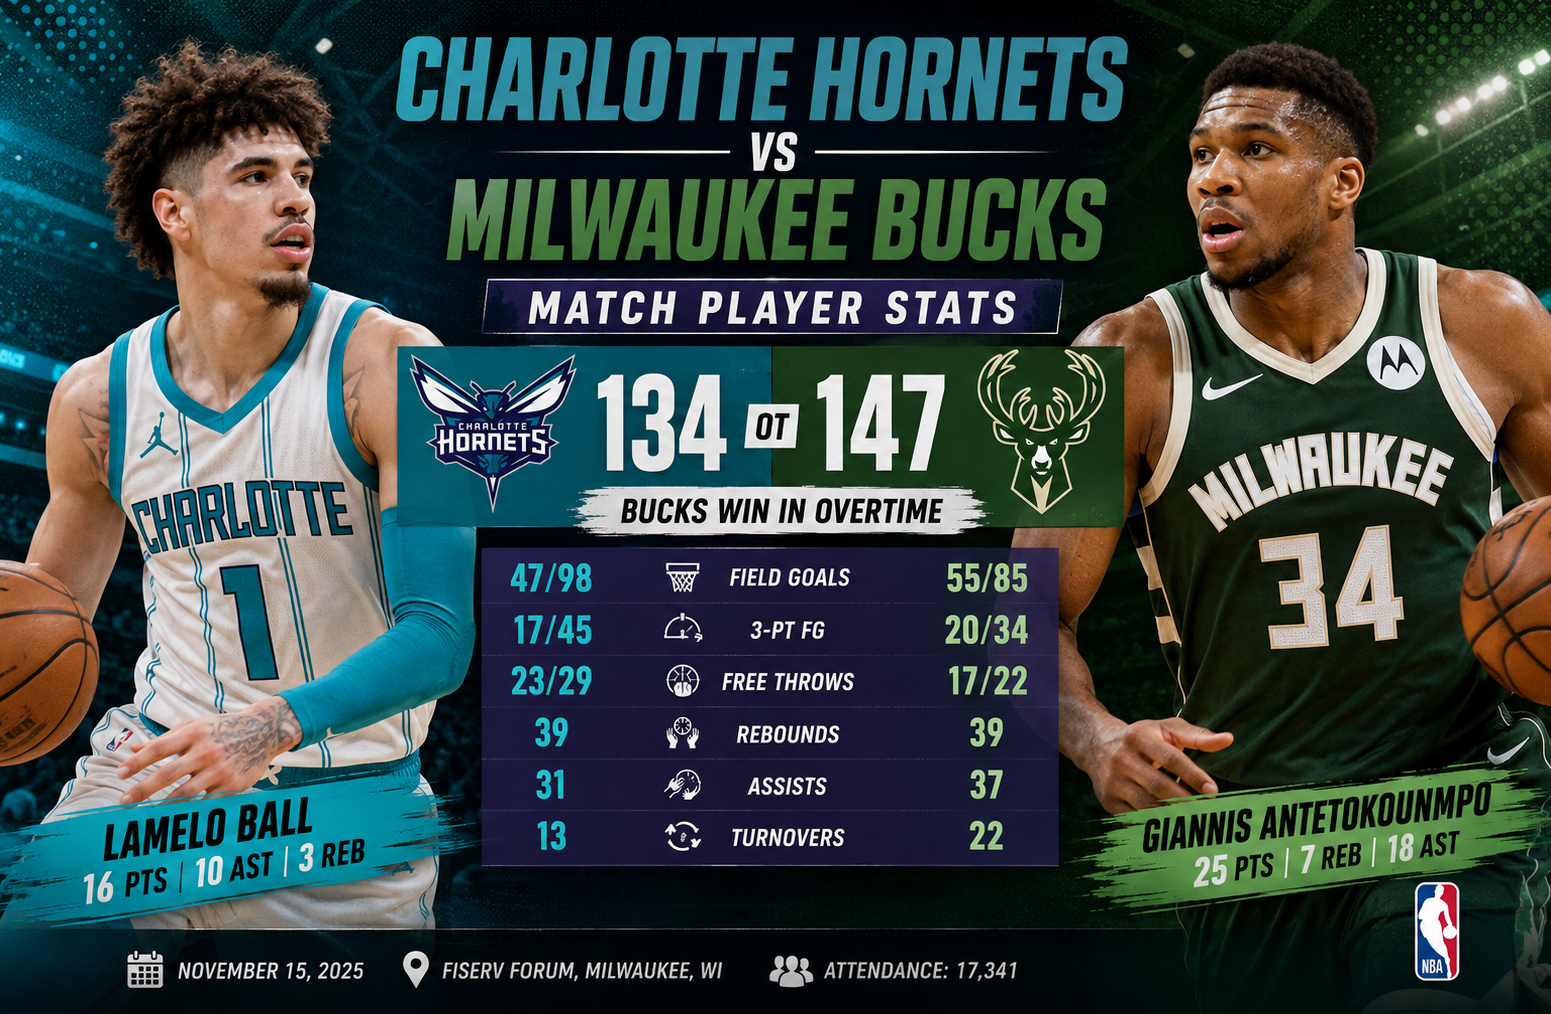
The Charlotte Hornets vs Milwaukee Bucks match player stats tell a much deeper story than the 147-134 final score suggests. Milwaukee survived a high-scoring NBA Cup battle in overtime, but Charlotte repeatedly exposed weaknesses and pushed the Bucks to the limit. Kyle Kuzma led Milwaukee with 29 points and 10 rebounds, Giannis Antetokounmpo produced an extraordinary 25-point, 18-assist, 7-rebound performance, while Charlotte received 32 points apiece from Miles Bridges and rookie Kon Knueppel. The official NBA record confirms the 147-134 overtime result, the 42-point Milwaukee third quarter, and the 18-5 overtime margin.
The game was played at Fiserv Forum in Milwaukee and became one of the most entertaining high-scoring contests of the early 2025-26 season. Charlotte shot well enough to win many ordinary games, but Milwaukee’s combination of three-point efficiency, passing, shot-making and overtime execution ultimately decided the result.
This article breaks down the numbers beyond the basic box score. Instead of simply listing points and rebounds, it explains which performances mattered most, why the game went to overtime, how the teams created their scoring opportunities, and what the individual statistics reveal about the matchup.
Game Overview
The matchup brought together two teams that had already played each other earlier in the week. Charlotte had won the first meeting 111-100, while Milwaukee responded in emphatic fashion in the rematch.
The second game ended:
| Category | Charlotte Hornets | Milwaukee Bucks |
| Final score | 134 | 147 |
| Regulation score | 129 | 129 |
| Overtime | 5 | 18 |
| Field goals | 47-98 | 55-85 |
| Field-goal percentage | 48% | 65% |
| Three-pointers | 17-45 | 20-34 |
| Three-point percentage | 38% | 59% |
| Free throws | 23-29 | 17-22 |
| Rebounds | 39 | 39 |
| Assists | 31 | 37 |
| Turnovers | 13 | 22 |
| Steals | 11 | 10 |
| Blocks | 1 | 3 |
The first thing that stands out is that Charlotte did not lose because it was careless with the basketball. In fact, the Hornets committed only 13 turnovers compared with 22 from Milwaukee.
That makes the result more interesting.
Milwaukee won because it was dramatically more efficient as a shooting team. The Bucks made 55 of 85 field-goal attempts, while Charlotte needed 98 attempts to make 47 shots.
That difference in shot quality and conversion was enormous.
Charlotte Hornets vs Milwaukee Bucks Match Player Stats: Top Performers
The individual numbers show that both teams received outstanding offensive performances.
Milwaukee Bucks Player Leaders
| Player | PTS | REB | AST | STL | BLK | FG |
| Kyle Kuzma | 29 | 10 | 5 | 4 | 1 | 11-17 |
| Giannis Antetokounmpo | 25 | 7 | 18 | 2 | 1 | 12-18 |
| Ryan Rollins | 20 | 8 | 4 | 8-12 | ||
| Myles Turner | 18 | 3 | 1 | 6-9 | ||
| Bobby Portis | 12 | 4 | 1 | 4-7 | ||
| Gary Harris | 10 | 3 | 5 | 4-7 |
Kyle Kuzma was Milwaukee’s leading scorer, but Giannis was arguably the most influential all-around player.
Kuzma’s 29 points came on 11-of-17 shooting, which translates to roughly 65% shooting from the field. He also collected 10 rebounds, delivered five assists and recorded four steals.
Giannis was even more unusual statistically.
He scored 25 points while shooting 12-of-18, but his 18 assists were the biggest number on the box score. He also had seven rebounds, two steals and a block.
That means his influence extended far beyond scoring.
Charlotte Hornets Player Leaders
| Player | PTS | REB | AST | STL | BLK | FG |
| Miles Bridges | 32 | 7 | 2 | 0 | 1 | 12-24 |
| Kon Knueppel | 32 | 3 | 3 | 3 | 0 | 12-20 |
| LaMelo Ball | 16 | 3 | 10 | 5-15 | ||
| Moussa Diabate | 15 | 11 | 1 | 5-8 | ||
| Tre Mann | 9 | 7 | 7 | 4-10 |
Charlotte’s scoring was led by two players rather than one.
Miles Bridges scored 32 points on 12-of-24 shooting and added seven rebounds. Kon Knueppel matched him with 32 points while shooting an excellent 12-of-20.
Knueppel’s performance was particularly notable because the game represented his first NBA appearance in his hometown. He also hit two critical three-pointers late in regulation that helped Charlotte force overtime. The official NBA recap identifies his 32-point performance as a season high at that point.
Kyle Kuzma’s 29-Point Performance
Kyle Kuzma was Milwaukee’s leading scorer and one of the most efficient players on either roster.
His final line:
29 points, 10 rebounds, 5 assists, 4 steals, 1 block, 11-of-17 shooting, 2-of-4 from three and 5-of-7 from the free-throw line.
There are several reasons this performance stands out.
First, Kuzma did not need a huge number of attempts to reach 29 points. Seventeen field-goal attempts produced 11 makes.
Second, he contributed in multiple areas.
The 10 rebounds gave Milwaukee a reliable presence on the glass, while five assists demonstrated that he was not simply operating as a scorer.
The four steals were another major contribution.
His performance was especially important because Milwaukee needed multiple scoring options around Giannis. If the Bucks had depended almost entirely on Antetokounmpo, Charlotte’s defense could have concentrated more heavily on him.
Instead, Kuzma punished the Hornets with efficient scoring.
Giannis Antetokounmpo’s 18 Assists
The most unusual number in the entire Charlotte Hornets vs Milwaukee Bucks match player stats was Giannis Antetokounmpo’s 18 assists.
Twenty-five points and seven rebounds would already constitute an excellent game.
Adding 18 assists changes the entire interpretation.
Giannis finished with:
- 25 points
- 7 rebounds
- 18 assists
- 7 turnovers
- 2 steals
- 1 block
- 12-of-18 shooting
The seven turnovers should not be ignored. They show that Milwaukee’s offense was not perfect.
However, his 18 assists demonstrate how effectively he created opportunities for teammates.
A player can dominate a game without scoring 40 points if his passing repeatedly produces efficient shots for others. That is exactly what happened here.
Milwaukee finished with 37 team assists, meaning Giannis accounted for nearly half of the team’s total assists himself.
His passing also explains why the Bucks could maintain their offensive efficiency despite committing 22 turnovers.
The offense generated enough quality opportunities to compensate.
Miles Bridges Delivers 32 Points
Miles Bridges gave Charlotte a legitimate scoring threat throughout the game.
His final line was:
32 points, 7 rebounds, 2 assists, 1 turnover and 12-of-24 shooting.
His three-point shooting was also important.
Bridges made six three-pointers on 15 attempts, giving him a 40% success rate from beyond the arc.
The biggest positive from his performance was efficiency relative to volume.
Bridges took 24 shots, the most among Charlotte players listed in the supplied statistics, but he still converted half of them.
His one turnover was another positive.
For Charlotte, the problem was not Bridges’ offensive production. The problem was that Milwaukee found ways to generate even more efficient offense.
Kon Knueppel’s Breakout Performance
Kon Knueppel may have been the most memorable Charlotte performer.
He scored 32 points on 12-of-20 shooting, including 4-of-9 from three-point range.
That is a 60% field-goal percentage.
For a rookie, producing that kind of efficiency in a nationally relevant NBA Cup game is significant.
But the timing of his scoring was just as important as the total.
Knueppel hit a three-pointer that tied the game at 125 with 1:34 remaining. Later, after Miles Bridges missed a dunk and Knueppel grabbed the rebound, he hit another three-pointer to tie the game at 129 with 21 seconds left.
Those shots helped force overtime.
This is an important distinction when analyzing player stats.
A box score tells you that Knueppel scored 32.
The game context tells you that some of those points arrived at the exact moments Charlotte needed them most.
LaMelo Ball’s Playmaking Impact
LaMelo Ball finished with:
16 points, 3 rebounds and 10 assists.
His shooting was less efficient than Knueppel’s or Bridges’.
He made 5 of 15 field-goal attempts and 2 of 6 three-point attempts.
Yet focusing only on his shooting would miss his main role in the game.
Ball’s 10 assists helped Charlotte create offense against a Milwaukee team that was shooting at an extraordinary rate.
The Hornets also benefited from his ability to move the ball and generate opportunities for Bridges, Knueppel and other scorers.
His performance illustrates why player evaluation should not rely only on points per game.
A 16-point, 10-assist performance can be more valuable to a team’s offensive structure than a higher-scoring individual night with limited creation.
Moussa Diabate Controls the Glass
Moussa Diabate quietly delivered one of Charlotte’s most valuable statistical performances.
He recorded:
15 points, 11 rebounds, 1 assist and 5-of-8 shooting.
The 11 rebounds led all players in the supplied Charlotte statistics.
That mattered because Milwaukee’s shooting advantage could have been even more damaging if the Bucks had also dominated the boards.
Instead, both teams finished with 39 rebounds.
Diabate’s contribution helped Charlotte remain competitive in a game where Milwaukee was converting shots at an unusually high rate.
Tre Mann’s All-Around Contribution
Tre Mann finished with:
- 9 points
- 7 rebounds
- 7 assists
- 3 turnovers
- 4-of-10 shooting
His scoring was modest, but his seven assists and seven rebounds show how Charlotte received contributions outside its main scorers.
The problem was that Charlotte needed nearly everything to go right offensively to keep pace with Milwaukee.
Against a team shooting 65% from the field and almost 59% from three, secondary contributions were helpful but not enough.
Myles Turner and Milwaukee’s Spacing
Myles Turner scored 18 points on 6-of-9 shooting.
More importantly, he made six three-pointers on eight attempts.
That is an extraordinary 75% three-point shooting rate in the game.
Turner’s shooting created a major problem for Charlotte’s defense.
When a big man can stretch the floor and make threes at that rate, defenders have to make difficult choices.
Help on Giannis?
Stay attached to Turner?
Protect the paint?
Close out on shooters?
Those decisions become harder when Milwaukee has multiple players capable of scoring efficiently.
Turner also finished as Milwaukee’s plus/minus leader at +27 according to the supplied game data.
His overtime contribution was particularly important. The game recap notes that Turner hit consecutive threes early in overtime as Milwaukee opened separation.
Ryan Rollins Provides 20 Points
Ryan Rollins added 20 points, eight rebounds and four assists while shooting 8-of-12.
He also connected on four of six three-point attempts.
That gave Milwaukee another efficient scoring option.
Rollins’ performance demonstrates why the Bucks were difficult to defend. Charlotte could not simply focus on Giannis and Kuzma.
When a third or fourth offensive option is shooting efficiently, defensive attention becomes much harder to allocate.
Quarter-by-Quarter Breakdown
The scoring pattern tells the story of the game.
| Quarter | Charlotte | Milwaukee | Difference |
| 1st | 33 | 34 | Milwaukee +1 |
| 2nd | 36 | 27 | Charlotte +9 |
| 3rd | 29 | 42 | Milwaukee +13 |
| 4th | 31 | 26 | Charlotte +5 |
| OT | 5 | 18 | Milwaukee +13 |
| Total | 134 | 147 | Milwaukee +13 |
Charlotte had the better second quarter.
The Hornets scored 36 while limiting Milwaukee to 27.
At halftime, Charlotte had built an eight-point advantage.
That should have put the Hornets in a strong position.
Instead, the third quarter completely changed the game.
The 42-Point Third Quarter
The biggest turning point was Milwaukee’s third quarter.
The Bucks scored 42 points.
That was the highest-scoring quarter of the game by either team.
More importantly, Milwaukee did not simply score a lot. It did so with remarkable efficiency.
The Bucks’ overall shooting numbers show the quality of the offensive execution:
55-of-85 from the field.
That is approximately 64.7%.
Their three-point shooting was even more striking:
20-of-34, approximately 58.8%.
Charlotte’s offense was strong, but Milwaukee’s efficiency created a completely different level of pressure.
Why Charlotte Still Forced Overtime
One of the most interesting parts of the game is that Milwaukee could not finish the game in regulation.
Charlotte responded after Milwaukee’s huge third quarter.
The Hornets scored 31 points in the fourth quarter compared with Milwaukee’s 26.
That brought the game to 129-129.
Knueppel’s late three-pointer was especially important.
This shows why the final score alone is misleading.
Milwaukee eventually won by 13, but the game was tied after four quarters.
The margin was created almost entirely in overtime.
Overtime Was the Decisive Difference
The overtime score was:
Milwaukee 18, Charlotte 5.
That 13-point overtime advantage exactly matches Milwaukee’s final winning margin.
In other words, after 48 minutes, there was no difference between the teams.
The entire 13-point final margin was produced during the five-minute overtime period.
That is one of the most important insights from the game.
Charlotte played well enough to force overtime.
It simply could not sustain that level of execution once the extra period began.
Milwaukee immediately attacked with confidence, while Charlotte struggled to generate the same offensive rhythm.
Shooting Efficiency Decided the Game
The clearest statistical explanation for the result is shooting.
Milwaukee:
55-of-85, 65%
Charlotte:
47-of-98, 48%
Charlotte attempted 13 more field goals.
That normally creates opportunities to compensate for inefficient shooting.
But Milwaukee’s efficiency was so much higher that the additional Charlotte attempts were not enough.
The three-point numbers reinforce the same conclusion.
Milwaukee made 20 three-pointers.
Charlotte made 17.
The difference was not huge in makes, but the Bucks needed only 34 attempts to reach 20 makes.
Charlotte needed roughly 45 attempts to make 17.
That is a substantial efficiency gap.
The Rebound Battle Was Even
Both teams finished with 39 rebounds.
That matters because it removes one potential explanation for the result.
Milwaukee did not win because it crushed Charlotte on the glass.
Charlotte also had 10 offensive rebounds.
Milwaukee had five.
That gave Charlotte additional possessions.
Yet the Hornets still lost.
This strengthens the argument that shooting efficiency was the primary factor.
Assists Show Milwaukee’s Offensive Connectivity
Milwaukee finished with 37 assists.
Charlotte finished with 31.
Both numbers are excellent for a high-scoring game.
But Milwaukee’s 37 assists are particularly important when combined with its 65% field-goal shooting.
The Bucks were not simply making difficult isolation shots.
They were frequently creating efficient looks through ball movement and player movement.
Giannis’ 18 assists were central to that.
The Bucks’ offense produced high-quality shots often enough to maintain an extraordinary shooting percentage.
Turnovers Tell a Different Story
Charlotte had a major advantage in turnovers.
The Hornets committed 13.
The Bucks committed 22.
That means Milwaukee gave the ball away nine more times.
Normally, that could be enough to decide a close game.
Yet Milwaukee still won comfortably after overtime.
This tells us that the Bucks compensated for their turnover problems through superior shot-making.
It also suggests an important area for future improvement.
If Milwaukee can maintain its offensive efficiency while reducing turnovers, the team’s offensive ceiling becomes even higher.
For Charlotte, the low turnover total was encouraging.
The Hornets protected possessions well enough to stay competitive despite Milwaukee’s shooting advantage.
Three-Point Shooting Was the Hidden Swing
Milwaukee’s 20 three-pointers were arguably the most important team statistic.
The Bucks shot approximately 59% from beyond the arc.
Charlotte shot approximately 38%.
The gap was especially damaging because three-point makes carry extra scoring value.
Milwaukee did not just make more threes.
It converted them at a much higher rate.
Players such as Myles Turner and Ryan Rollins were major contributors in this area.
Turner’s six-of-eight shooting from three was particularly difficult for Charlotte to overcome.
Free Throws Were Not the Main Story
Charlotte made 23 of 29 free throws.
Milwaukee made 17 of 22.
That gave Charlotte a small advantage at the line.
But it was not enough to offset Milwaukee’s field-goal and three-point superiority.
This is another example of why a box-score analysis needs context.
Charlotte won the free-throw category.
It also won the turnover category.
It tied the rebound category.
Yet Milwaukee still won the game.
The decisive advantage was shooting efficiency.
Charlotte Hornets vs Milwaukee Bucks Match Player Stats: What They Reveal
The most useful way to read the statistics is to connect individual performances with team strategy.
Charlotte had two 32-point scorers.
Milwaukee had one 29-point scorer, one 25-point scorer, a 20-point scorer and an 18-point scorer among its leading contributors.
That distribution matters.
Charlotte’s offense was highly productive at the top.
Milwaukee’s offense was more balanced.
The Bucks also received exceptional playmaking from Giannis.
That combination made their attack harder to contain.
Who Was the Best Player?
If the question is strictly about scoring, Kyle Kuzma was Milwaukee’s leader with 29.
If the question is about all-around influence, Giannis has the strongest argument.
His 25 points, 18 assists and seven rebounds created an enormous offensive footprint.
However, Myles Turner’s +27 plus/minus is also worth noting.
He did not lead Milwaukee in scoring, rebounds or assists, but his combination of efficient scoring and floor spacing had a major effect on the game.
For Charlotte, Kon Knueppel and Miles Bridges both deserve recognition.
Knueppel’s 32 points on 12-of-20 shooting were exceptionally efficient, while Bridges matched the scoring total and added seven rebounds.
Was Charlotte Actually Competitive?
Absolutely.
The final 147-134 score can make the game appear more one-sided than it was.
Charlotte led by eight at halftime.
The Hornets came back from Milwaukee’s third-quarter surge.
The game was tied 129-129 after regulation.
Only then did Milwaukee pull away.
The overtime collapse changed the final score dramatically.
This is important for anyone using the statistics to evaluate the teams.
Charlotte was not simply outplayed for 53 minutes.
The game was essentially decided in a five-minute overtime period after both teams had produced 48 minutes of competitive basketball.
What Milwaukee Did Better
Milwaukee’s advantages can be summarized in five areas:
- Field-goal efficiency: 65% compared with Charlotte’s 48%.
- Three-point efficiency: roughly 59% compared with roughly 38%.
- Assists: 37 compared with 31.
- Offensive balance: several Milwaukee players scored efficiently.
- Overtime execution: Milwaukee outscored Charlotte 18-5.
The combination was decisive.
What Charlotte Did Well
Charlotte’s performance also contained several positives.
The Hornets:
- Scored 134 points.
- Produced two 32-point scorers.
- Received 10 assists from LaMelo Ball.
- Got 11 rebounds from Moussa Diabate.
- Committed only 13 turnovers.
- Grabbed 10 offensive rebounds.
- Shot 79% from the free-throw line.
- Forced overtime after trailing in the third quarter.
Those numbers show that Charlotte had enough offensive quality to compete.
The main issue was not a lack of scoring.
It was the inability to match Milwaukee’s extraordinary efficiency and overtime execution.
Historical Head-to-Head Context
The supplied game data places the teams at 1-1 in the season series immediately after this game.
The first meeting ended with Charlotte winning 111-100.
The second meeting ended with Milwaukee winning 147-134 in overtime.
That split makes the two games particularly useful when comparing team styles.
The first game was lower scoring.
The second became an offensive shootout.
The difference illustrates how much a single matchup can change based on player availability, shooting efficiency and game flow.
The supplied later results list additional meetings on December 30 and January 3, meaning the broader season series eventually moved beyond this 1-1 point.
Why the Game Matters for Player Evaluation
A single game should never be treated as a complete evaluation of a player.
However, individual games can reveal useful patterns.
For example, Giannis’ 18 assists show how effective Milwaukee can be when its primary star operates as a high-level creator rather than simply a scorer.
Kuzma’s 29-point, 10-rebound performance shows the value of secondary scoring.
Turner’s shooting demonstrates the importance of frontcourt spacing.
Knueppel’s 32 points show his potential as an efficient perimeter scorer.
LaMelo’s 10 assists highlight his importance as Charlotte’s offensive organizer.
Diabate’s 11 rebounds demonstrate the value of interior activity even when a player is not one of the team’s highest scorers.
What the Box Score Does Not Tell You
Traditional statistics are useful, but they do not capture everything.
They do not fully show:
- How often a player forced a defensive rotation.
- How many open shots were created by off-ball movement.
- Which defender was responsible for a difficult matchup.
- How much pressure a player placed on the rim.
- Whether a turnover came from an aggressive play or a poor decision.
- How fatigue affected overtime execution.
That is why the best analysis combines box-score numbers with game context.
In this matchup, the box score tells us Milwaukee shot exceptionally well.
The game context explains why that efficiency mattered so much.
A Practical Way to Read These Player Stats
When analyzing an NBA game like this one, readers should avoid ranking players solely by points.
A better process is:
Step 1: Check scoring volume
Who scored the most?
This identifies the primary offensive contributors.
Step 2: Check efficiency
How many shots did each player need?
Kuzma’s 29 points on 17 attempts were more efficient than simply looking at the 29-point total suggests.
Step 3: Check playmaking
Who created shots for teammates?
Giannis’ 18 assists and LaMelo’s 10 assists are critical here.
Step 4: Check possession control
Turnovers, offensive rebounds and steals help explain how many opportunities each team created.
Step 5: Check the game situation
Were the points scored when the game was close?
Knueppel’s late regulation threes carried more situational value than an equivalent number of points scored during a comfortable lead.
Step 6: Examine overtime separately
Overtime should not be treated as just another quarter.
It is a pressure situation with shorter rotations, tired players and greater importance attached to every possession.
Milwaukee’s 18-5 advantage in overtime was the clearest example.
Frequently Asked Questions
What was the final score between the Hornets and Bucks?
The Milwaukee Bucks defeated the Charlotte Hornets 147-134 in overtime.
Who led the Bucks in scoring?
Kyle Kuzma led Milwaukee with 29 points and also recorded 10 rebounds and five assists.
How many points did Miles Bridges score?
Miles Bridges scored 32 points for Charlotte while shooting 12-of-24 from the field.
How did Kon Knueppel perform?
Kon Knueppel scored 32 points on 12-of-20 shooting, including four three-pointers. He also recorded three rebounds and three assists.
How many assists did Giannis Antetokounmpo have?
Giannis Antetokounmpo recorded 18 assists along with 25 points and seven rebounds.
Why did the game go to overtime?
Charlotte and Milwaukee were tied 129-129 after regulation. Knueppel made a late three-pointer to tie the game at 129, sending the contest into overtime.
Conclusion
The Charlotte Hornets vs Milwaukee Bucks match player stats reveal a game that was much closer than the final 13-point margin suggests.
Charlotte received outstanding scoring from Miles Bridges and Kon Knueppel, while LaMelo Ball supplied 10 assists and Moussa Diabate controlled the glass with 11 rebounds. The Hornets also protected the ball well and eventually forced the game into overtime.
Milwaukee’s difference was efficiency.
Kyle Kuzma led the Bucks with 29 points and 10 rebounds. Giannis Antetokounmpo controlled the game as a passer with 18 assists. Ryan Rollins provided 20 points, while Myles Turner added 18 points and elite three-point shooting.
The most important team statistic was Milwaukee’s 65% field-goal shooting. The Bucks also made 20 three-pointers at approximately 59%, creating an efficiency advantage that Charlotte could not overcome.
Ultimately, regulation produced a 129-129 tie. Overtime produced the result.
Milwaukee scored 18 points in the extra period while Charlotte managed only five. That five-minute stretch transformed an evenly matched game into a 147-134 Bucks victory.
For readers studying the matchup, the biggest lesson is simple: the final score does not tell the complete story. The player statistics, shooting efficiency, possession numbers, fourth-quarter comeback and overtime execution together explain how Milwaukee escaped with the win.