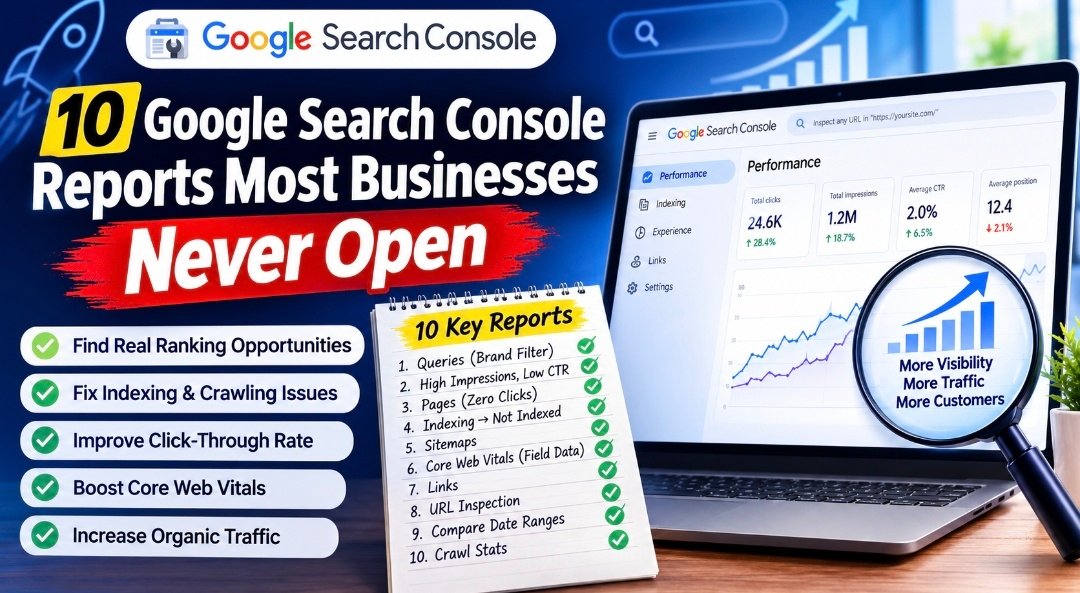
10 Google Search Console Reports Most Businesses Never Open
Search Console is the only tool that shows you what Google actually thinks about your site. It is free, most businesses already have it installed, and the overwhelming majority of them look at exactly one thing: the total clicks graph on the front page.
Everything genuinely useful is two clicks further in. Here are ten reports that answer questions people routinely pay consultants to investigate.
1. Performance → Queries, with your brand name filtered out
The question it answers: does my site have any search visibility at all?
Go to Performance, add a Query filter, set it to “Queries not containing” and enter your brand name. Look at what remains.
Ranking first for your own company name proves nothing: nothing else competes for that string, your domain contains it, and every link pointing at you uses it. Google would have to work to rank you anywhere else.
For a large share of business sites, filtering the brand out leaves close to nothing. That is the actual diagnostic, and it means the site functions as a business card: people who already know you can find you, and nobody else can.
Takes ninety seconds. Tells you more than most audits.
2. Performance → high impressions, low CTR
The question it answers: where am I already ranking and failing to get the click?
Sort your queries by impressions descending, then look at the CTR column. Anything with substantial impressions and a CTR well below the benchmark for its position is a title and description problem, not a ranking problem.
For reference, position one takes somewhere between 22% and 40% depending on which study you use: FirstPageSage puts it at 39.8%, Backlinko’s four-million-result analysis at 27.6%, Semrush at around 22%. They disagree on the number and agree on the shape. If you sit at position three and take 4%, the ranking is fine and the listing is not being clicked.
Rewriting a title and description is a thirty-minute job with no approval chain. This is the closest thing to free traffic that exists.
3. Performance → Pages, sorted by impressions with zero clicks
The question it answers: which pages is Google showing that nobody wants?
Pages accumulating impressions and no clicks are being surfaced for queries they do not satisfy. Usually the page targets a query it does not actually answer, or the title promises something the page does not deliver.
This is also where you find pages competing with each other. If three of your URLs appear for the same query, Google is splitting your own signal across them and ranking all three worse than one focused page would rank.
4. Indexing → Pages, and specifically the “Not indexed” reasons
The question it answers: why isn’t this page ranking?
Because it is not in the index. This is the most common cause of “we published it and nothing happened” and it is almost never checked.
The reasons list is the useful part:
- Discovered – currently not indexed. Google knows about it and decided it was not worth crawling. Usually a quality or authority signal.
- Crawled – currently not indexed. Google looked and declined to index. Frequently thin or duplicative content.
- Duplicate, Google chose different canonical. You have two pages Google considers the same, and it picked the other one.
- Excluded by ‘noindex’ tag, someone blocked it, often accidentally, often a staging directive that shipped to production.
- Soft 404: the page returns 200 but looks empty or error-like to Google.
Each reason implies completely different work. A page that cannot be indexed cannot rank, no matter how good it is.
5. Indexing → Sitemaps, checked against reality
The question it answers: am I telling Google about the right pages?
Two failures show up here. A sitemap listing URLs that redirect, 404, or are blocked wastes crawl budget and dilutes trust in the file. A sitemap missing important pages means Google is discovering them only through internal links, which is slower and less reliable.
Also worth checking: whether your lastmod dates are honest. If every URL’s date bumps on every deploy regardless of whether content changed, Google learns to ignore the field entirely, and real changes get discovered more slowly.
6. Experience → Core Web Vitals, field data not lab data
The question it answers: does my site actually work for real users?
This report shows Chrome User Experience Report data: real measurements from real visitors on real devices. That is meaningfully different from a PageSpeed Insights lab score run on a fast machine, and the two frequently disagree.
The gap widens in markets where the device mix skews toward mid-range Android hardware and connectivity is congested. A site scoring 95 in the lab can be failing in the field, and the field is what counts.
Google’s own case studies show the stakes: Vodafone Italy gained 8% more sales from a 31% LCP improvement, Redbus recorded an 80-100% increase in mobile conversion rate after cutting layout shift to zero and halving Time to Interactive, and Agrofy saw a 76% reduction in load abandonment.
7. Links → Top linking sites and top linked pages
The question it answers: what authority do I actually have, and where is it pointing?
Two things to look at.
Top linking sites tells you whether your link profile is real. Genuine profiles are lumpy and slow, a mention here, a resource page there. A large number of unfamiliar domains that appeared in a short window is the signature of a purchased campaign, whether you commissioned it or a previous provider did.
Top linked pages is the more actionable one. These are your strongest pages. Now check what they link to internally. A page with real external authority that links only to your homepage and a contact form is a reservoir with no outlet, and repointing it at the pages you actually want to rank is free.
8. URL Inspection, on any page you are worried about
The question it answers: what does Google specifically think about this URL?
Paste any URL into the bar at the top. You get the indexing status, the canonical Google selected (which may not be the one you declared), the last crawl date, whether it is mobile usable, and any structured data detected.
The “Test Live URL” button then fetches the page as Googlebot right now and shows you the rendered HTML. This is the definitive check for whether your JavaScript content is visible to search engines, and it settles arguments that otherwise run for weeks.
9. Performance → compare two date ranges
The question it answers: what actually changed, and when?
The comparison mode is buried behind the date picker and it is the most useful analytical feature in the tool. Compare the last 28 days against the previous 28, or this quarter against the same quarter last year, then switch to the Queries tab and sort by click difference.
This separates three things that look identical on a single-period report: queries you genuinely lost, queries where you held position but lost clicks to zero-click behaviour, and seasonal movement that will reverse on its own.
The second category is the one growing fastest. Click-through rate at positions one through five fell roughly 17.92% year over year per GrowthSRC’s 200,000-keyword study, as AI Overviews and search features absorbed clicks above the organic results. A query where impressions held and clicks fell has not been lost to a competitor, and treating it as though it has produces exactly the wrong work.
10. Settings → Crawl stats
The question it answers: is Google having trouble reaching my site?
Buried under Settings and almost never opened. It reports total crawl requests over time, average response time, and a breakdown by response code and file type.
Three things to look for. A sustained rise in average response time means the server is struggling, and crawl budget contracts when a crawler cannot fetch pages without straining the host. A spike in 5xx responses indicates intermittent failures that may be invisible to you because they happen at crawl time rather than during a human visit. Crawl requests heavily skewed toward one file type or one directory often reveals that Google is spending its budget on faceted URLs, parameters or paginated archives rather than on the pages that matter.
On small sites this rarely matters. On anything above a few thousand URLs it is where you find out why new pages take weeks to appear.
The habit that makes this pay
None of these reports is difficult. They go unread because there is no prompt to open them.
A monthly thirty-minute routine covers it: brand-filtered queries, high-impression/low-CTR list, indexing reasons, and Core Web Vitals field data. Fix what surfaces. That is more useful than most retainers deliver in a month, and it costs nothing.
The reason to know this is not to replace expertise. It is to be able to evaluate it. Any seo expert nepal businesses hire, or anyone else, should be referencing these reports in their reasoning. A provider whose recommendations never touch Search Console data is working from assumptions.
It also changes what you can ask for. Instead of “improve our rankings,” you can say: forty pages show as Crawled – currently not indexed, six queries have impressions above 500 with CTR under 2%, and our strongest linked page points are nowhere useful. Those are specific, answerable briefs.
Practitioners in markets where keyword tools are thin lean on this data especially heavily: a seo expert in Pokhara or anywhere the major research tools under-report local search volume will often find that Search Console query data is the only reliable source of what people are actually typing. The tools estimate. Search Console counts.