Dallas Mavericks vs LA Clippers Match Player Stats
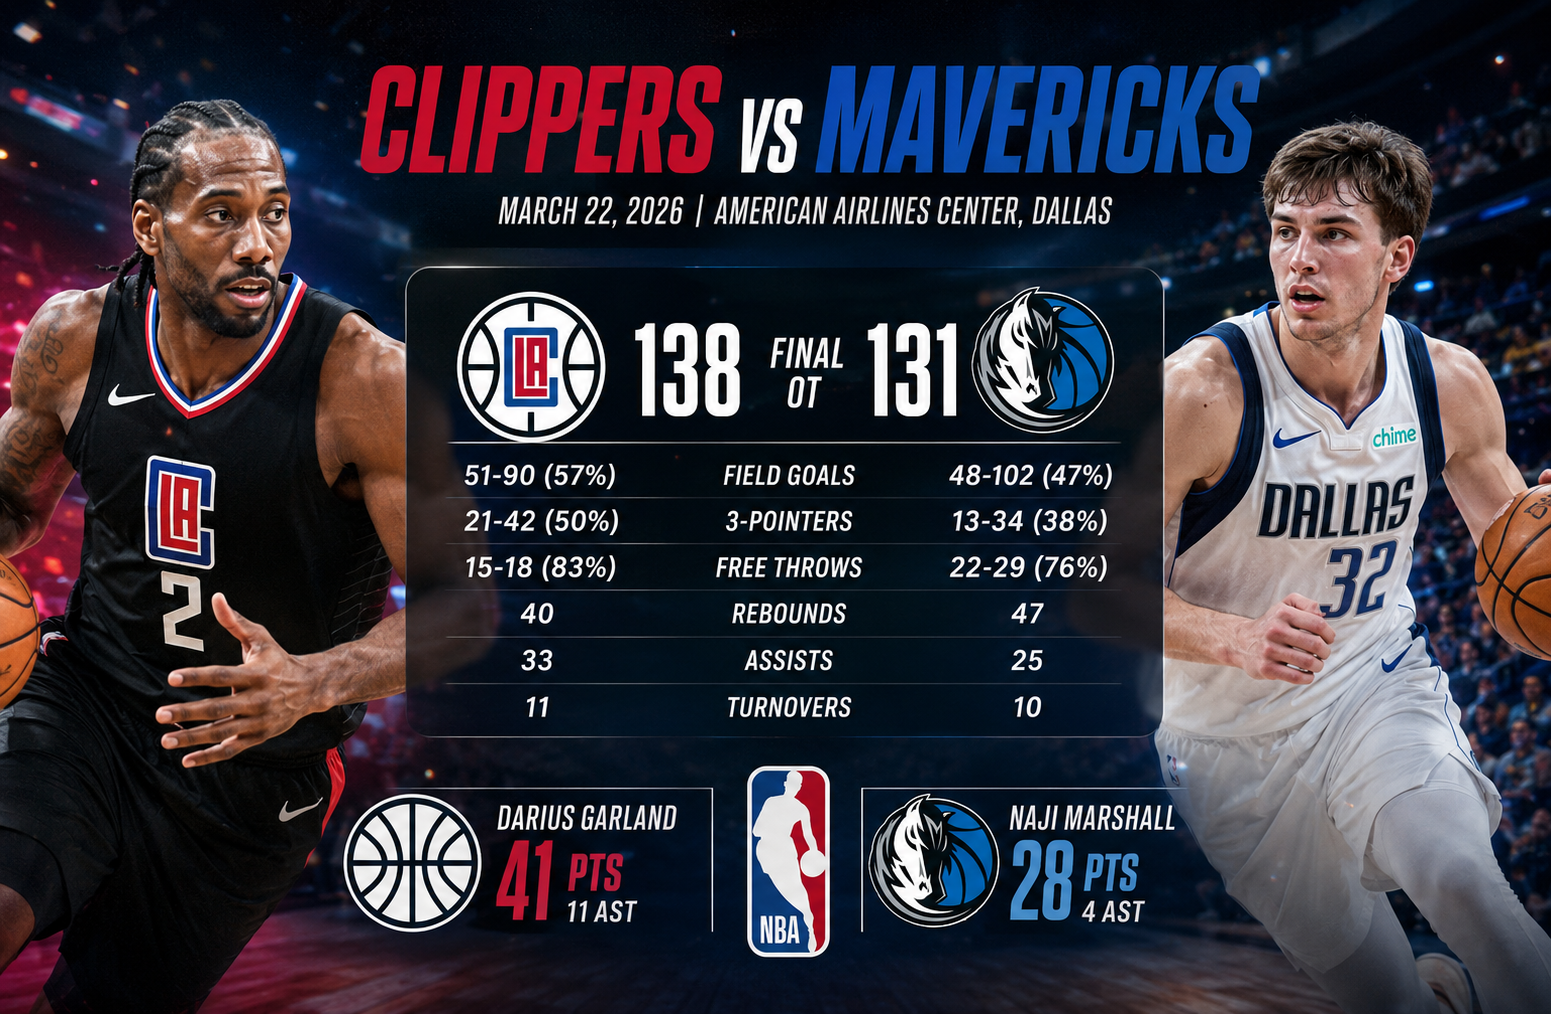
The dallas mavericks vs la clippers match player stats from the March 22, 2026 matchup tell the story of a game that Dallas nearly controlled before Los Angeles turned the contest around in overtime. The Clippers defeated the Mavericks 138-131 at American Airlines Center, overcoming a 10-point deficit after the first quarter and surviving a tightly contested fourth quarter. Darius Garland led all scorers with 41 points and 11 assists, while Kawhi Leonard added 34 points and delivered several decisive plays late in regulation and overtime. For Dallas, Naji Marshall scored 28 points, P.J. Washington added 21, and Cooper Flagg contributed across several categories, but the Mavericks could not convert their strong start into a home victory.
The official NBA game record lists the matchup as a 138-131 overtime victory for Los Angeles, with Garland’s 41-point performance and Leonard’s 34 points standing out among the individual numbers.
Dallas Mavericks vs LA Clippers Match Player Stats: Game Overview
The final score can make the game look more one-sided than it actually was. Dallas started aggressively and finished the first quarter with a 42-32 advantage. Los Angeles gradually reduced the gap, won the third quarter 37-27, and eventually forced overtime.
The Clippers then outscored Dallas 16-9 in the extra period.
That sequence is important because it shows why a box score should be read as more than a collection of individual totals. Dallas had more rebounds, more points in the paint, and fewer turnovers. Los Angeles, however, created a much more efficient shooting profile and received elite shot-making from Garland and Leonard.
The key game information was:
| Category | LA Clippers | Dallas Mavericks |
| Final score | 138 | 131 |
| Regulation | 122 | 122 |
| Overtime | 16 | 9 |
| Field goals | 51-90 | 48-102 |
| Field-goal percentage | 57% | 47% |
| Three-pointers | 21-42 | 13-34 |
| Three-point percentage | 50% | 38% |
| Free throws | 15-18 | 22-29 |
| Free-throw percentage | 83% | 76% |
| Rebounds | 40 | 47 |
| Assists | 33 | 25 |
| Turnovers | 11 | 10 |
| Steals | 8 | 5 |
| Blocks | 10 | 6 |
The official NBA box score confirms Los Angeles shot 51 of 90 from the field and 21 of 42 from three, while Dallas made 48 of 102 field-goal attempts and 13 of 34 from long range.
How the Game Developed Quarter by Quarter
First Quarter: Dallas Takes Control
Dallas immediately established the tempo.
The Mavericks scored 42 points in the opening period, compared with 32 from Los Angeles. That 10-point advantage gave Dallas an early platform and reflected a more productive attack around the basket.
Dallas ultimately finished with 64 points in the paint, compared with 48 for the Clippers. That advantage was particularly important early because the Mavericks were able to generate offense without relying exclusively on perimeter shooting.
Naji Marshall was one of the major contributors to Dallas’ offensive start. He eventually finished with 28 points on 11 of 23 shooting.
Second Quarter: Clippers Stabilize
The second quarter was much closer.
Los Angeles scored 31 points while Dallas added 30. The Clippers did not erase the deficit, but they prevented Dallas from extending it.
Garland began establishing himself as the primary offensive engine. His combination of three-point shooting and playmaking became increasingly difficult for Dallas to contain.
At halftime, the Mavericks still held the advantage, but the direction of the game was beginning to change.
Third Quarter: Los Angeles Changes the Game
The third quarter was the turning point.
The Clippers scored 37 points while Dallas managed 27. That 10-point swing erased Dallas’ first-quarter advantage and transformed the contest into a one-possession battle entering the fourth.
Garland’s perimeter efficiency was a major factor. He finished 15 of 24 from the field and 8 of 12 from three, producing an extraordinary 62.5% field-goal percentage and 66.7% three-point percentage.
Leonard also remained highly efficient, making 12 of 22 shots and 5 of 9 three-pointers.
Fourth Quarter: Neither Team Can Finish It
The fourth quarter ended with both teams tied at 122.
Dallas scored 23 points, while Los Angeles scored 22.
This was the point where individual decision-making mattered more than raw offensive volume. The Mavericks had opportunities to win in regulation, including a late sequence involving Cooper Flagg and P.J. Washington.
Leonard ultimately scored the basket that tied the game late in regulation. The official NBA recap confirms that Leonard’s late score helped send the game to overtime.
Overtime: Clippers Execute Better
The overtime period belonged to Los Angeles.
The Clippers scored 16 points against Dallas’ nine.
Derrick Jones Jr. was particularly influential. He hit two three-pointers in overtime, including the shot that gave Los Angeles the lead for good.
Garland and Leonard then helped close the game.
The official NBA play-by-play shows Jones Jr. hitting a three-pointer to move Los Angeles ahead 125-124, followed by another Jones three and additional baskets from Leonard.
That was the decisive difference. Dallas had competed effectively for four quarters, but Los Angeles generated cleaner offense once the game entered its highest-pressure phase.
Darius Garland’s 41-Point Performance
Darius Garland was the defining individual performer.
His final line was:
41 points, 15-24 FG, 8-12 3PT, 3-3 FT, 3 rebounds, 11 assists, 1 steal, 1 block, 4 turnovers, +9.
The scoring total alone is impressive, but the shooting efficiency makes the performance even more significant.
Garland made:
- 62.5% of his field-goal attempts
- 66.7% of his three-point attempts
- 100% of his free throws
He also produced 11 assists.
That means Garland was not simply scoring at a high volume. He was simultaneously creating opportunities for teammates and forcing Dallas to account for him as a perimeter shooting threat.
His eight made three-pointers were especially damaging because Dallas could not simply collapse toward the paint to limit his driving opportunities.
The official NBA game record identifies Garland as the game’s leading scorer with 41 points and leading assister with 11 assists.
Kawhi Leonard’s 34 Points and Late-Game Impact
Kawhi Leonard produced the second-highest scoring total of the game with 34 points.
His statistical line was:
34 points, 12-22 FG, 5-9 3PT, 5-5 FT, 3 rebounds, 5 assists, 2 steals, 1 block, 2 turnovers, +23.
The plus-23 rating is particularly interesting.
Garland had the bigger scoring night, but Leonard finished with the strongest plus-minus figure among the listed major players. His 34 points came on 54.5% shooting, while he also connected on 55.6% of his three-point attempts.
Leonard’s value became even more obvious in the closing stages.
He scored the tying basket late in regulation and then continued playing through overtime. The NBA recap noted that Leonard played 36 minutes, including the entire overtime period.
That late-game availability mattered.
In a game where Dallas had already built a substantial early lead, Los Angeles needed a reliable half-court scorer who could create a quality attempt when the defense tightened. Leonard provided exactly that.
Derrick Jones Jr. Provides the Overtime Spark
Derrick Jones Jr. finished with 15 points, six rebounds, five assists and one steal.
His shooting was highly efficient:
- 6-9 from the field
- 3-5 from three
- 66.7% from the field
- 60% from three
But the most important part of his performance came in overtime.
Jones Jr. scored two crucial three-pointers in the extra period. Those shots changed the scoreboard at precisely the moment Dallas needed defensive stops.
His +5 rating also reflected a productive overall performance.
This is an important example of why scoring leaders do not always determine the most important moments of a basketball game. Garland and Leonard carried the largest offensive loads, but Jones Jr.’s overtime shooting helped turn their work into a win.
Brook Lopez’s Interior Contribution
Brook Lopez finished with 10 points and nine rebounds.
His complete line included:
10 points, 4-8 FG, 2-6 3PT, 9 rebounds, 2 assists and 2 blocks.
His nine rebounds led the Clippers.
Lopez also gave Los Angeles a legitimate interior presence while remaining capable of spacing the floor. Although his three-point shooting was less efficient than Garland’s or Leonard’s, his ability to operate outside the paint created additional room for the Clippers’ primary creators.
His two blocks were also useful against a Dallas team that generated 64 points in the paint.
Dallas Mavericks Player Stats Breakdown
Dallas had several strong individual performances despite the defeat.
The most important offensive contributors were Naji Marshall, P.J. Washington, Cooper Flagg and Marvin Bagley III.
Naji Marshall Leads Dallas With 28 Points
Naji Marshall led Dallas in scoring with 28 points.
His final line:
28 points, 11-23 FG, 1-6 3PT, 5-7 FT, 2 rebounds, 4 assists, 2 steals, 2 turnovers, -19.
Marshall’s 11 made field goals were the most on the Mavericks.
He was especially effective attacking inside and generating offense without depending heavily on three-point shooting.
However, the -19 plus-minus illustrates the difference between individual production and team outcome. Marshall scored efficiently enough to lead Dallas, but the Mavericks struggled to win his minutes overall.
That does not mean the plus-minus number alone explains his performance. Plus-minus is heavily influenced by lineups, opponent runs and game context. In this case, it is better understood alongside the larger team numbers.
P.J. Washington Adds 21 Points
P.J. Washington scored 21 points on 7 of 14 shooting.
His complete line:
21 points, 7-14 FG, 3-8 3PT, 4-5 FT, 6 rebounds, 1 steal, -7.
Washington’s three-point shooting gave Dallas an important secondary scoring option.
He also played a role in the late-game drama. After Dallas gained a 122-120 lead, Washington was involved in a late offensive sequence before the game eventually went to overtime.
His 21 points helped Dallas maintain offensive balance around Marshall and Flagg.
Cooper Flagg’s All-Around Performance
Cooper Flagg’s box score was one of the most interesting from the game.
He recorded:
18 points, 6-16 FG, 6-7 FT, 10 rebounds, 8 assists, 4 blocks and 2 turnovers.
Although the supplied player data lists nine rebounds, the official NBA game record credits Flagg with nine rebounds and seven assists. This distinction matters when publishing statistical content, so the official box score should be treated as the authoritative version for the final game record.
The bigger point remains the same: Flagg affected the game in multiple categories.
He was only two assists short of a double-double and recorded four blocks. His defensive activity helped Dallas compete despite Los Angeles’ elite shooting.
His scoring efficiency, however, was less impressive than the Clippers’ primary scorers. He shot 6 of 16 from the field and did not make either of his two three-point attempts.
That combination illustrates the challenge facing Dallas. Flagg could contribute as a rebounder, passer and defender, but Los Angeles had multiple players capable of producing highly efficient scoring possessions.
Marvin Bagley III Gives Dallas Efficient Bench Scoring
Marvin Bagley III provided one of Dallas’ most efficient offensive performances.
He scored 17 points while making 7 of 8 field-goal attempts.
He also made both of his three-point attempts.
His final line included seven rebounds and one assist.
From a pure shooting perspective, Bagley was extremely effective. His performance demonstrates how bench efficiency can help a team survive stretches when starters struggle.
The problem was that Dallas did not receive enough comparable efficiency across the full rotation.
Klay Thompson Provides Perimeter Efficiency
Klay Thompson scored 12 points on 4 of 6 shooting.
Most notably, he made all four of his three-point attempts.
That gave him a perfect 100% three-point shooting night.
His +14 plus-minus was also one of Dallas’ best marks.
This is an important detail because it shows that the Mavericks had successful individual stretches even though they ultimately lost. Thompson’s shooting gave Dallas valuable spacing, and his positive plus-minus suggests his minutes were productive in the context of the game.
Ryan Nembhard Creates Offense
Ryan Nembhard finished with:
13 points, 6-10 FG, 5 rebounds, 9 assists, 1 free throw made on 1 attempt, and +17.
His nine assists were the most for Dallas.
Nembhard was therefore an important counterpoint to the scoring numbers. Dallas did not lack playmaking entirely. It generated 25 team assists, and Nembhard was responsible for a substantial portion of them.
His +17 rating was also the best among the listed Dallas players.
That combination suggests that the Mavericks’ offensive issues were not simply a lack of creation. The larger issue was converting enough of those possessions into efficient scoring against a Clippers offense that was exceptionally accurate.
Comparing the Two Teams’ Shooting Efficiency
Shooting efficiency was probably the clearest statistical separator.
Los Angeles:
51-90 from the field, 56.7%
Dallas:
48-102 from the field, 47.1%
That difference is enormous over a full NBA game.
Dallas attempted 12 more field goals than Los Angeles, but the Clippers still scored seven more points in regulation and overtime.
The three-point difference was even more revealing.
Los Angeles made 21 threes.
Dallas made 13.
That is an eight-three-pointer advantage.
With each made three worth three points, Los Angeles generated 24 more points from made three-pointers before considering any other scoring difference.
The Clippers also shot 50% from three.
Dallas shot approximately 38%.
This is one of the clearest reasons the game moved away from Dallas despite the Mavericks’ advantages in rebounding and paint scoring.
Rebounding Favored Dallas, But It Wasn’t Enough
Dallas finished with 47 rebounds compared with 40 for Los Angeles.
Daniel Gafford led the Mavericks with 13 rebounds, while Cooper Flagg also had a strong rebounding contribution.
That gave Dallas a seven-rebound advantage.
Ordinarily, winning the rebounding battle can provide an important pathway to victory.
But rebounding does not automatically compensate for shooting inefficiency.
Dallas had more possessions and more interior production, yet Los Angeles converted its offensive opportunities at a much higher rate.
This is a useful lesson when interpreting player statistics: a team can dominate one traditional category while losing because another category has a much larger impact on scoring efficiency.
Assists Reveal the Clippers’ Offensive Structure
Los Angeles recorded 33 assists.
Dallas recorded 25.
That eight-assist difference highlights how effectively the Clippers shared offensive creation.
Garland alone produced 11 assists.
Jones Jr. and Leonard each added five.
The result was a balanced distribution of playmaking responsibilities.
Dallas also had useful individual creators, especially Nembhard with nine assists and Flagg with seven according to the official game record, but the overall team total remained lower.
The Clippers’ passing helped create high-quality shots, which is reflected in their 57% team field-goal percentage.
Turnovers Were Nearly Even
Dallas committed 10 turnovers.
Los Angeles committed 11.
This is important because it rules out a common explanation for the final result.
The Clippers did not win because Dallas repeatedly gave away possessions.
In fact, Dallas had one fewer turnover.
The difference came primarily from what happened after the possession was retained.
Los Angeles converted its opportunities with much greater efficiency.
That is a more meaningful takeaway than simply saying one team protected the ball better.
Free Throws Helped Dallas, But Not Enough
Dallas made 22 of 29 free throws.
Los Angeles made 15 of 18.
Dallas therefore had a seven-made-free-throw advantage.
That helped offset part of the Clippers’ three-point advantage.
But the gap from outside the arc was too significant.
The game therefore became a strong example of how multiple scoring mechanisms interact. Dallas had advantages at the free-throw line and on the glass, while Los Angeles dominated field-goal efficiency and three-point production.
The Clippers’ advantages were ultimately more influential.
The Most Important Advanced Takeaway
The simplest way to understand the game is through effective shooting.
Los Angeles did not merely shoot more efficiently from the field. It combined excellent overall shooting with elite three-point accuracy.
A simplified effective field-goal perspective illustrates the difference.
Effective field-goal percentage gives extra value to made three-pointers because they are worth 50% more than made two-pointers.
Using the basic formula:
eFG% = (FGM + 0.5 × 3PM) ÷ FGA
Los Angeles produced approximately:
(51 + 0.5 × 21) ÷ 90 = 68.3%
Dallas produced approximately:
(48 + 0.5 × 13) ÷ 102 = 53.4%
That is a massive gap.
The exact measure should always be calculated from the official box score, but the comparison makes the central point clear: Los Angeles’ shooting profile was dramatically more valuable possession for possession.
What the Plus-Minus Numbers Tell Us
Plus-minus should never be treated as a complete player evaluation tool, but it can add useful context.
Among the Clippers:
- Kawhi Leonard: +23
- Darius Garland: +9
- Derrick Jones Jr.: +5
- John Collins: +5
- Isaiah Jackson: +3
- Brook Lopez: +1
Among the Mavericks:
- Ryan Nembhard: +17
- Klay Thompson: +14
- Daniel Gafford: 0
- Khris Middleton: -1
- P.J. Washington: -7
- Marvin Bagley III: -9
- Naji Marshall: -19
- Cooper Flagg: -15
- Max Christie: -15
The numbers highlight an interesting contrast.
Dallas received strong positive minutes from Nembhard and Thompson, yet its primary scoring contributors finished with negative ratings.
That suggests Dallas had productive lineups but struggled to sustain them.
For Los Angeles, Leonard’s +23 is particularly notable because it aligned with both high scoring efficiency and late-game influence.
Why Dallas Lost Despite Several Strong Statistical Advantages
The Mavericks won several traditional categories.
They had:
- Seven more rebounds
- One fewer turnover
- Seven more made free throws
- 16 more points in the paint
Yet they lost.
The explanation is the combination of shooting efficiency and three-point volume.
Los Angeles made eight more threes.
The Clippers also shot nearly 10 percentage points better from the field.
That efficiency allowed Los Angeles to overcome Dallas’ advantages elsewhere.
This is why looking only at points, rebounds and assists can produce an incomplete understanding of a basketball game.
A better evaluation asks:
- How efficiently did each team score?
- How many quality three-point opportunities were created?
- Who controlled late-game possessions?
- Which players remained effective when defensive pressure increased?
- Which lineups generated sustainable two-way results?
On those questions, Los Angeles had the stronger overall profile.
Previous Meetings and Series Context
The matchup also had meaningful recent history.
The supplied series information records:
- Game 1: Clippers 133, Mavericks 127
- Game 2: Mavericks 114, Clippers 110
- Game 3: Clippers 138, Mavericks 131
That gave Los Angeles a 2-1 advantage across the listed meetings.
The March matchup therefore continued a pattern in which both teams had already demonstrated an ability to score effectively against the other.
The March 21 game was particularly high scoring, with both teams exceeding 120 points in regulation before overtime.
What the Player Stats Say About Each Team
Los Angeles Clippers
The Clippers’ numbers show a team that won through shot creation, perimeter accuracy and experienced late-game scoring.
Garland was the offensive catalyst.
Leonard was the late-game stabilizer.
Jones Jr. became the overtime difference-maker.
Lopez supplied rebounding and interior defense.
The team also received useful contributions from Isaiah Jackson, Nicolas Batum, Jordan Miller and Kris Dunn.
Most importantly, Los Angeles did not depend on one statistical category.
It combined:
- 57% field-goal shooting
- 50% three-point shooting
- 33 assists
- 10 blocks
- 11 turnovers
That is a strong statistical foundation for an overtime victory.
Dallas Mavericks
Dallas demonstrated enough offensive production to win the game but not enough consistency to finish it.
Marshall’s 28 points and Washington’s 21 gave the team scoring punch.
Flagg provided rebounding, passing and rim protection.
Nembhard generated nine assists.
Thompson provided perfect three-point shooting.
Bagley III offered efficient bench scoring.
The issue was not the absence of individual performances.
It was the inability to combine those performances into the same level of overall efficiency as Los Angeles.
Biggest Winners From the Box Score
Darius Garland
Garland was the clear statistical standout.
His 41 points and 11 assists made him the game’s most complete offensive performer.
Kawhi Leonard
Leonard’s 34 points, +23 rating and late-game scoring made him arguably the most influential player in the closing minutes.
Derrick Jones Jr.
Jones Jr. deserves special attention because his overtime shooting directly changed the outcome.
Ryan Nembhard
Nembhard’s 13 points, nine assists and +17 rating showed how effectively he contributed when on the floor.
Klay Thompson
Four made three-pointers on four attempts gave Dallas valuable perimeter efficiency.
Biggest Lessons From the Match
The first lesson is that shooting quality can overwhelm traditional statistical advantages.
- Dallas rebounded better.
- Dallas committed fewer turnovers.
- Dallas got to the free-throw line more effectively.
Yet Los Angeles won because it generated far more efficient field-goal production.
The second lesson is that late-game shot-making matters disproportionately.
The game was tied after four quarters. Once overtime began, Los Angeles produced several high-value possessions through Jones Jr., Leonard and Garland.
The third lesson is that player evaluation needs context.
Marshall’s 28 points were valuable, but his -19 rating shows that his scoring did not translate into a winning overall lineup result.
Nembhard scored fewer points but finished +17.
Both numbers can be true at the same time.
The fourth lesson is that Cooper Flagg’s contribution cannot be evaluated through scoring alone.
His rebounding, passing and shot-blocking gave Dallas meaningful two-way value even though his shooting efficiency was below the level of the Clippers’ stars.
How to Read These Stats for Future Matchups
When evaluating a future Mavericks-Clippers game, it makes sense to begin with the same categories that decided this contest.
Start With Three-Point Efficiency
The March game showed how quickly the three-point battle can reshape the scoreboard.
Compare:
- Three-point attempts
- Three-point makes
- Three-point percentage
- Corner-three production
- Attempts created by drive-and-kick possessions
Then Examine Shot Efficiency
Field-goal percentage provides a useful starting point, but effective field-goal percentage gives a better picture when three-point volume differs.
Check Playmaking
Assists provide evidence of how well an offense is creating shots for teammates.
Garland’s 11 assists were particularly important because his scoring threat forced Dallas to make difficult defensive choices.
Examine Rebounding in Context
Dallas won the rebounding battle, but that advantage did not determine the outcome.
The important question is not simply who grabbed more rebounds. It is whether those rebounds created additional efficient scoring opportunities.
Finally, Study the Fourth Quarter and Overtime
Close games are often decided by a small number of possessions.
The regulation and overtime sequence in this matchup demonstrates why late-game statistics deserve separate attention from full-game averages.
FAQ
Who led the Clippers in scoring against Dallas?
Darius Garland led the Clippers with 41 points. He also recorded 11 assists and made eight three-pointers.
Who led the Mavericks in scoring?
Naji Marshall led Dallas with 28 points on 11 of 23 shooting.
What was the final score?
The Clippers defeated the Mavericks 138-131 in overtime at American Airlines Center.
Which player had the most rebounds?
Daniel Gafford led the Mavericks with 13 rebounds based on the supplied game data, while Brook Lopez led Los Angeles with nine.
How many three-pointers did the Clippers make?
Los Angeles made 21 of 42 three-point attempts, shooting exactly 50% from beyond the arc.
Did Cooper Flagg have a strong all-around game?
Yes. Flagg contributed points, rebounds, assists and four blocks. His overall production extended well beyond scoring, although his field-goal shooting was less efficient than the Clippers’ leading scorers.
Conclusion
The dallas mavericks vs la clippers match player stats from this overtime thriller reveal a game decided by efficiency rather than simple statistical volume.
Dallas produced 47 rebounds, 64 points in the paint and committed only 10 turnovers. Those are meaningful advantages. The Mavericks also received strong scoring from Naji Marshall and P.J. Washington, valuable playmaking from Ryan Nembhard, efficient shooting from Klay Thompson and an all-around contribution from Cooper Flagg.
But Los Angeles produced the more efficient offensive performance.
The Clippers shot 57% from the field and 50% from three. Darius Garland delivered 41 points and 11 assists, Kawhi Leonard added 34 points with a +23 rating, and Derrick Jones Jr. hit two critical three-pointers in overtime.
The result was a 138-131 victory after Dallas and Los Angeles finished regulation tied at 122.
For anyone studying player statistics, the biggest takeaway is straightforward: the most useful analysis comes from connecting individual numbers to team efficiency, lineup impact and game situation. A 28-point performance, a nine-assist night or a 13-rebound effort can all be valuable, but the surrounding numbers explain whether those contributions actually changed the outcome.
In this matchup, the decisive combination was elite perimeter shooting, efficient scoring and superior execution when the game reached its highest-pressure moments.