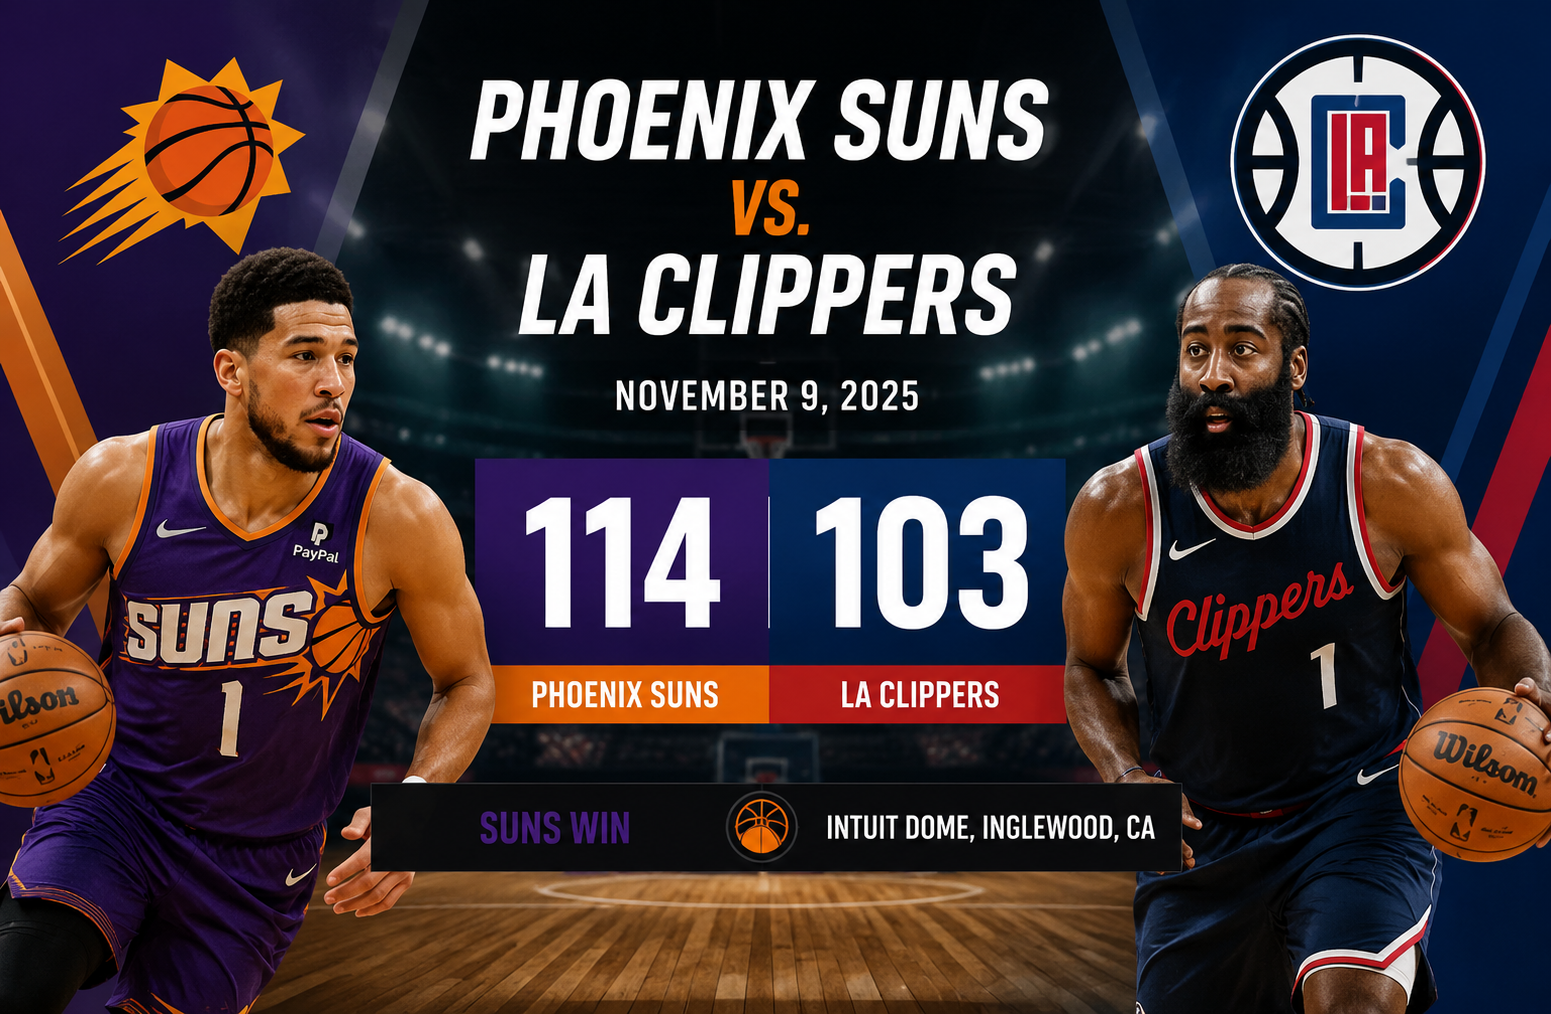
phoenix suns vs la clippers match player stats
The Phoenix Suns vs. LA Clippers matchup on November 9, 2025, produced a 114-103 Phoenix victory at Intuit Dome in Inglewood, California. The final margin was 11 points, but the game was more competitive than the score alone suggests. Phoenix established control early, built a substantial halftime advantage, absorbed a major third-quarter response from Los Angeles, and then closed the game effectively in the fourth quarter. Devin Booker was at the center of the Suns’ performance, contributing 21 points, 10 rebounds, and 9 assists, while Ivica Zubac delivered an equally notable individual effort for the Clippers with 21 points and 15 rebounds.
The matchup also offered an interesting statistical contrast. Los Angeles actually shot a better percentage from the field, converting 41 of 77 attempts for approximately 53 percent. Phoenix, however, created more value from three-point range, made 16 of 38 attempts for approximately 42 percent, controlled the glass with 42 rebounds to the Clippers’ 27, and produced 30 assists. Those differences help explain why Phoenix won despite Los Angeles having the superior overall field-goal percentage.
Phoenix Suns vs. LA Clippers: Game Overview
The Suns entered the contest with a 4-5 record and improved to 5-5 after the victory. Their road record moved to 1-4. The Clippers came into the game at 3-5 and dropped to 3-6, with their home record becoming 3-3.
The game was played at Intuit Dome in Inglewood, with an announced attendance of 18,961.
Phoenix’s 114 points came from a balanced offensive performance that became especially effective during the first half. The Suns scored 35 points in the opening quarter and followed that with 25 points in the second. That gave them a 60-46 halftime lead.
Los Angeles responded forcefully after halftime. The Clippers scored 34 points in the third quarter while Phoenix managed 25. That reduced the deficit to five points entering the fourth quarter.
Instead of allowing the comeback to continue, Phoenix responded with 29 points in the final period. Los Angeles scored 23, leaving the Suns with an 11-point victory.
The quarter-by-quarter progression tells an important part of the story:
| Quarter | Phoenix Suns | LA Clippers |
| First | 35 | 29 |
| Second | 25 | 17 |
| Third | 25 | 34 |
| Fourth | 29 | 23 |
| Final | 114 | 103 |
The result therefore cannot be described simply as a wire-to-wire blowout. Phoenix created separation early, Los Angeles made a serious third-quarter push, and Phoenix ultimately restored control.
How Phoenix Built Its 11-Point Victory
The most useful way to understand this game is to look beyond the final score.
Phoenix won through a combination of perimeter shooting, rebounding, ball movement, and efficient free-throw shooting. The Suns made 16 three-pointers, compared with 10 for Los Angeles. That six-made-three advantage translated into an 18-point difference in three-point scoring.
At the same time, Phoenix collected 15 more rebounds than the Clippers. That is a substantial possession-related advantage.
The Suns also recorded 30 assists while turning the ball over only 12 times. That combination suggests a strong level of offensive organization. Los Angeles had 26 assists and 11 turnovers, so the turnover margin itself was not a major reason for the outcome.
Instead, Phoenix’s biggest statistical advantages came from shooting behind the arc and winning the rebounding battle.
The Three-Point Difference
Phoenix shot 16-for-38 from three-point range, or approximately 42 percent.
Los Angeles made 10 of 33 three-point attempts, or approximately 30 percent.
That means Phoenix attempted five more threes and made six more.
The difference is significant because three-point shooting can quickly change the mathematical shape of a basketball game. A team that makes six additional three-pointers gains 18 points from those makes alone.
Los Angeles compensated to some extent through its 53 percent overall field-goal percentage. However, Phoenix’s combination of 48 percent overall shooting and 42 percent three-point shooting gave the Suns a more favorable offensive profile.
Phoenix Won the Rebounding Battle
The Suns finished with 42 rebounds.
The Clippers had 27.
That 15-rebound advantage is one of the clearest indicators of Phoenix’s control over the game.
Rebounding is especially important because it can influence both ends of the floor. Defensive rebounds prevent opponents from receiving additional opportunities, while offensive rebounds can create extra possessions for the team that secures them.
The supplied statistics do not separate offensive and defensive rebounds, so it would be inappropriate to claim exactly how many second-chance points Phoenix generated. What can be stated confidently is that the overall rebounding margin heavily favored the Suns.
Devin Booker Nearly Recorded a Triple-Double
Devin Booker was the standout statistical contributor for Phoenix.
He finished with:
- 21 points
- 10 rebounds
- 9 assists
That line put Booker one assist short of a triple-double.
His 10 rebounds are particularly notable because Booker is generally discussed primarily in terms of scoring and playmaking. In this game, however, his contribution extended across multiple areas of the box score.
The nine assists also highlight the importance of his role in Phoenix’s offensive creation. The Suns finished with 30 assists overall, meaning Booker accounted for a substantial share of their recorded assists.
His performance therefore cannot be evaluated only by looking at his 21 points. His value came from his ability to contribute as a scorer, rebounder, and facilitator.
Why Booker’s All-Around Line Matters
A 21-point performance might look ordinary for an elite offensive player, but the context changes when it comes with 10 rebounds and 9 assists.
Booker’s production indicates that Phoenix did not need him to carry the entire scoring load.
Instead, he could influence the game by creating opportunities for teammates and helping control possessions.
That distinction is important when analyzing team basketball. A player’s impact is not always captured by scoring totals. Rebounding and assists can directly influence possession quality, offensive rhythm, and the ability to maintain pressure on an opponent.
In this particular matchup, Booker’s near triple-double fits well with Phoenix’s 30-assist team total.
Ivica Zubac Delivered a Strong Performance for Los Angeles
Ivica Zubac was the Clippers’ top scorer and top rebounder, finishing with 21 points and 15 rebounds.
His 15 rebounds were the highest individual rebounding total listed in the supplied game data.
Zubac’s performance stands out even more because Los Angeles finished with only 27 rebounds as a team. That means he accounted for more than half of the Clippers’ total rebounds.
James Harden led Los Angeles in assists with 13, giving the Clippers a clear contrast between their primary interior contributor and their principal facilitator.
The combination of Zubac’s 21 points and 15 rebounds with Harden’s 13 assists suggests that Los Angeles received significant individual contributions. The problem was that those contributions did not translate into enough overall efficiency from outside the arc or enough control of the rebounding battle as a team.
James Harden’s 13 Assists Were a Major Positive
James Harden recorded 13 assists, the highest assist total for either team in the supplied statistics.
That figure is important because Los Angeles finished with 26 assists as a team. Harden therefore accounted for exactly half of the Clippers’ recorded assists.
The Clippers were not completely stagnant offensively. Their 26 assists show that the ball moved effectively at various points of the game.
The bigger issue was converting that offensive activity into enough scoring.
Los Angeles shot 41-for-77 from the field, which is approximately 53 percent. That is an excellent overall field-goal percentage. Yet the Clippers made only 10 of 33 three-point attempts and shot 11-for-18 from the free-throw line.
This illustrates why one shooting percentage rarely explains an entire basketball game.
The Clippers Shot Better From the Field but Still Lost
One of the most interesting aspects of this matchup is that Los Angeles finished with the better field-goal percentage.
The Clippers shot approximately 53 percent from the field.
Phoenix shot approximately 48 percent.
At first glance, that might suggest Los Angeles should have won.
But basketball scoring efficiency is broader than field-goal percentage.
Phoenix made more three-pointers, shot free throws at a higher percentage, and collected considerably more rebounds.
Phoenix’s shooting statistics were:
- 40-for-83 from the field
- 16-for-38 from three
- 18-for-21 from the free-throw line
Los Angeles posted:
- 41-for-77 from the field
- 10-for-33 from three
- 11-for-18 from the free-throw line
The field-goal percentages favor Los Angeles.
The three-point production strongly favors Phoenix.
The free-throw percentage also favors Phoenix, with the Suns converting approximately 86 percent compared with approximately 61 percent for the Clippers.
This is a useful reminder that evaluating a basketball game requires looking at several connected indicators rather than relying on one statistic.
Phoenix’s Offensive Efficiency Was More Balanced
Phoenix scored 114 points while producing 30 assists and committing 12 turnovers.
The Suns also made 18 of 21 free throws.
That combination points toward a relatively balanced offensive attack.
The Suns did not rely exclusively on three-point shooting. They made 40 field goals overall and supplemented those baskets with 16 three-pointers and 18 free throws.
Their 30 assists also suggest that scoring opportunities were distributed through team play rather than being completely dependent on individual isolation possessions.
This balance became particularly important when Los Angeles made its third-quarter run.
A team can struggle to recover from a momentum swing if its offense depends too heavily on one method of scoring. Phoenix instead entered the fourth quarter with multiple ways to produce points.
The Third Quarter Changed the Game
The third quarter was the Clippers’ best period.
Los Angeles scored 34 points while Phoenix scored 25.
After trailing 60-46 at halftime, the Clippers reduced the deficit to five points heading into the fourth.
That 34-25 third-quarter advantage represented a 9-point swing in Los Angeles’ favor.
The comeback demonstrates that Phoenix did not dominate every phase of the contest.
The Clippers found enough offensive rhythm to turn what had been a comfortable Phoenix advantage into a competitive fourth-quarter game.
This is arguably the most important turning point of the matchup.
Phoenix’s response was even more important.
Phoenix’s Fourth-Quarter Response
The Suns scored 29 points in the fourth quarter.
The Clippers scored 23.
After losing the third quarter by nine points, Phoenix won the fourth by six.
That response prevented Los Angeles from completing the comeback.
The Suns did not need another explosive quarter. They simply needed to regain control and produce enough offense to keep the Clippers from turning their momentum into a victory.
This is one of the clearest lessons from the game.
Strong teams do not necessarily avoid every momentum shift. They need to respond effectively when the game changes.
Phoenix’s fourth-quarter performance was therefore more meaningful than simply adding 29 points to the final score. It represented a successful response to the Clippers’ strongest stretch of the night.
Phoenix’s Defense Created Extra Pressure
The Suns recorded nine steals and two blocks.
The Clippers had five steals and five blocks.
The steal advantage was therefore four in Phoenix’s favor.
At the same time, the Suns committed 12 turnovers compared with 11 by Los Angeles. Phoenix did not win because of a dramatically better turnover margin.
Instead, the defensive difference can be viewed through multiple components.
Phoenix generated more steals, controlled the boards, and limited Los Angeles to 103 points despite the Clippers shooting approximately 53 percent from the field.
The two blocks indicate that rim protection was not the primary statistical story for Phoenix. Rebounding and perimeter disruption were more prominent elements in the available defensive numbers.
Why the Rebounding Margin Was So Important
The 42-27 rebounding advantage deserves additional attention because it provides context for the final result.
Phoenix had 15 more rebounds than Los Angeles.
Meanwhile, the Suns also had 12 turnovers compared with 11 for the Clippers.
That means Phoenix did not receive a meaningful advantage from forcing a significantly lower number of turnovers.
The rebounding difference therefore becomes even more significant when looking at the possession battle.
Without the full possession-by-possession data, it would be wrong to calculate an exact number of extra possessions generated from rebounds. However, the 15-rebound margin clearly shows that Phoenix was much more successful at securing the ball after missed shots.
That kind of control can help a team sustain an offensive advantage over four quarters.
Phoenix’s Free-Throw Shooting Was Another Advantage
The Suns went 18-for-21 from the free-throw line.
That is approximately 86 percent.
The Clippers went 11-for-18, or approximately 61 percent.
Phoenix therefore made seven more free throws despite attempting only three more.
The difference was 14 points at the line.
Free-throw shooting alone does not explain the 11-point final margin because the two teams’ scoring totals are influenced by every possession. Still, it was a clear efficiency advantage for Phoenix.
The Suns were particularly reliable when they reached the line.
Los Angeles, by comparison, left seven free throws unconverted.
In a game decided by 11 points, missed free throws can become meaningful, especially when combined with a three-point shooting disadvantage.
Phoenix’s 42 Percent Three-Point Shooting Stood Out
Phoenix attempted 38 three-pointers and made 16.
That is approximately 42 percent.
For a team taking that many shots from behind the arc, maintaining a percentage above 40 percent is highly valuable.
Los Angeles attempted 33 threes and made 10.
The Clippers’ approximately 30 percent conversion rate meant that their perimeter volume did not produce the same level of return.
This difference is one of the simplest explanations for the scoring gap.
Phoenix made 16 threes.
Los Angeles made 10.
That six-basket difference from three-point range represented an 18-point advantage in three-point scoring.
The Clippers made up some of that difference with their superior overall field-goal percentage, but not enough to overcome Phoenix’s perimeter advantage.
Starting Lineups and Team Structure
Phoenix’s listed starters were:
- Dillon Brooks
- Mark Williams
- Grayson Allen
- Devin Booker
- Jalen Green
The Clippers’ listed starters were:
- Derrick Jones Jr.
- Ivica Zubac
- James Harden
- Bradley Beal
- Kris Dunn
The starting lineups show two teams with different combinations of scoring, size, playmaking, and perimeter defense.
Phoenix had Booker as the central offensive organizer, while the starting group also included multiple perimeter players.
Los Angeles had Harden as its primary playmaker and Zubac as a major interior presence.
The individual statistics reinforce those roles.
Booker led Phoenix in points, rebounds, and assists.
Zubac led the Clippers in points and rebounds.
Harden led Los Angeles in assists.
That distribution provides a useful snapshot of how the teams’ offensive responsibilities were reflected in the final box score.
Season Series: Phoenix Leads 2-1
The supplied data lists Phoenix as leading the season series 2-1.
That gives the November 9 result additional context within the matchup.
Rather than viewing the game as an isolated result, the 2-1 season-series advantage indicates that Phoenix had won two of the three meetings between the teams at that point.
However, the season-series statistic should not be used to make assumptions about future games. Individual matchups can change based on injuries, rotations, shooting performance, schedule conditions, and other factors.
The most reliable conclusion from the supplied information is simply that Phoenix held the 2-1 edge in the season series.
What the Game Says About Phoenix
The strongest takeaway for Phoenix is versatility.
The Suns won even though they did not have the better overall field-goal percentage.
They won because several other parts of their statistical profile worked together.
Phoenix:
- Scored 114 points
- Made 16 three-pointers
- Shot approximately 42 percent from three
- Made 18 of 21 free throws
- Collected 42 rebounds
- Recorded 30 assists
- Produced nine steals
- Committed 12 turnovers
The combination is more revealing than any single number.
A team that shoots 48 percent overall, makes 16 threes, rebounds the ball well, and generates 30 assists has multiple ways to win.
That was particularly useful after Los Angeles cut the deficit to five points in the third quarter.
What the Game Says About the Clippers
The Clippers’ numbers show that they were capable of producing quality offense but struggled to turn that production into enough total points.
Their 53 percent field-goal percentage was excellent.
Zubac produced 21 points and 15 rebounds.
Harden supplied 13 assists.
The team also scored 34 points in the third quarter.
Those are meaningful positives.
The weaknesses were more concentrated in three areas:
- Three-point shooting
- Free-throw efficiency
- Team rebounding
Los Angeles made only 10 of 33 three-point attempts.
The Clippers also made 11 of 18 free throws.
Most significantly, they were outrebounded 42-27.
That combination made it difficult to overcome Phoenix’s strong perimeter shooting.
The Biggest Statistical Mismatch
If one statistic has to be identified as the clearest difference between the teams, the 15-rebound margin is arguably the strongest candidate.
The three-point gap was also enormous.
Phoenix made six more threes.
But rebounding affects the broader possession battle, while three-point shooting directly affects scoring efficiency.
Together, those two advantages explain much of the result.
The Suns were not dramatically better in every category. They simply won some of the categories that mattered most.
That is an important distinction.
Basketball games are rarely decided because one team wins every statistical category. More often, the winner establishes an advantage in a few high-impact areas and avoids giving too much back elsewhere.
A Closer Look at the Halftime Advantage
Phoenix led 60-46 at halftime.
The 14-point halftime margin was built through a particularly strong second quarter.
Phoenix scored 25 points in the second period.
Los Angeles scored only 17.
The Suns therefore added eight points to their lead during the second quarter after already winning the first quarter 35-29.
That first-half sequence is important because it shows that Phoenix did not suddenly create its advantage in one explosive burst.
The Suns steadily expanded the margin.
Los Angeles then changed the direction of the game in the third quarter.
This creates a three-stage structure:
Stage One: Early Phoenix Control
Phoenix scored 35 points in the opening period and led by six.
Stage Two: Phoenix Extends the Lead
The Suns won the second quarter 25-17 and entered halftime ahead by 14.
Stage Three: Clippers Respond, Suns Recover
Los Angeles won the third quarter 34-25, but Phoenix answered by winning the fourth 29-23.
That sequence gives a much clearer understanding of the game’s flow than the final score alone.
Why the Final Score Can Be Misleading
A final score of 114-103 suggests an 11-point game.
That is accurate, but it does not show how the game moved.
Phoenix led by 14 at halftime.
Los Angeles then won the third quarter by nine.
That means the Clippers entered the final period only five points behind.
The final 11-point margin was therefore created largely through Phoenix’s fourth-quarter response.
This distinction matters for anyone evaluating the game from a tactical or performance perspective.
A team that wins by 11 after nearly surrendering a 14-point halftime advantage has experienced a very different game from a team that leads by 11 from start to finish.
Phoenix Suns vs. LA Clippers: Key Takeaways
The Phoenix Suns vs. LA Clippers matchup produced several clear lessons from the available data.
1. Three-point shooting mattered
Phoenix made 16 threes compared with 10 for Los Angeles.
That was an 18-point advantage in three-point scoring.
2. Rebounding favored Phoenix heavily
The Suns grabbed 42 rebounds compared with 27 for the Clippers.
That 15-rebound margin was one of the game’s biggest statistical differences.
3. Booker influenced every major area
Booker finished with 21 points, 10 rebounds, and 9 assists.
His performance was much broader than his scoring total.
4. Zubac was highly productive
Zubac recorded 21 points and 15 rebounds.
His rebounding total was especially notable.
5. Harden created offense
Harden led the Clippers with 13 assists and accounted for half of Los Angeles’ team assists.
6. Phoenix responded to adversity
After Los Angeles won the third quarter 34-25, Phoenix recovered in the fourth.
That response preserved the victory.
7. Overall field-goal percentage did not tell the whole story
Los Angeles shot approximately 53 percent from the field, better than Phoenix’s approximately 48 percent.
Yet Phoenix still won comfortably because of its advantages in three-point shooting, free throws, and rebounding.
What Fans and Analysts Should Watch in Similar Matchups
The most useful lesson from this game is not simply that Phoenix won.
It is that the box score illustrates why analysts should evaluate several efficiency indicators together.
When examining a future matchup between teams with similar scoring averages, look at:
- Three-point volume and accuracy
- Rebounding differential
- Free-throw conversion
- Assist-to-turnover relationship
- Scoring by quarter
- Individual creation
- Defensive disruption
These categories often reveal the structure behind the final score.
For example, if one team shoots better overall but loses badly from three-point range and on the boards, the field-goal percentage alone can create a misleading impression.
The Phoenix and Los Angeles statistics provide a clear example of that principle.
A Practical Framework for Reading the Box Score
For readers who want to analyze basketball games more effectively, the following framework can be useful.
Start With the Final Score
The final score establishes the basic result but says little about how the game developed.
Check the Quarter Breakdown
Quarter scoring reveals momentum shifts.
In this matchup, the quarter breakdown immediately shows Phoenix’s first-half dominance and Los Angeles’ third-quarter comeback.
Compare Shooting Profiles
Do not stop at field-goal percentage.
Compare overall shooting, three-point shooting, and free throws separately.
Check Rebounds
A large rebounding margin can indicate meaningful control of missed-shot possessions.
Examine Assists and Turnovers
Assists provide context for offensive organization, while turnovers help show whether teams are giving away possessions.
Look at Individual Contributions
Identify the players who led in scoring, rebounding, and assists.
This helps explain how team production was distributed.
Finally, Connect the Numbers
The final step is interpretation.
In this game, the story is not simply that Phoenix shot 48 percent and Los Angeles shot 53 percent.
The deeper story is that Phoenix compensated with better three-point production, superior free-throw accuracy, significantly more rebounds, and strong team playmaking.
Full Statistical Snapshot
The following figures summarize the supplied game data:
| Category | Phoenix Suns | LA Clippers |
| Final Score | 114 | 103 |
| Field Goals | 40-83 | 41-77 |
| Field-Goal Percentage | 48% | 53% |
| Three-Pointers | 16-38 | 10-33 |
| Three-Point Percentage | 42% | 30% |
| Free Throws | 18-21 | 11-18 |
| Free-Throw Percentage | 86% | 61% |
| Rebounds | 42 | 27 |
| Assists | 30 | 26 |
| Turnovers | 12 | 11 |
| Steals | 9 | 5 |
| Blocks | 2 | 5 |
The numbers show why this was not a simple shooting contest.
Los Angeles had the better overall field-goal percentage and more blocks.
Phoenix had the better three-point percentage, free-throw percentage, rebounding total, assist total, and steal total.
Those collective advantages were enough to produce the 114-103 result.
Referees and Game Details
The listed referees for the matchup were Pat Fraher, J.T. Orr, and Andy Nagy.
The supplied game data lists the game time as 8:30 AM on November 9, 2025.
The venue was Intuit Dome in Inglewood, California, and attendance was listed at 18,961.
Because the purpose of this analysis is to interpret the supplied game record, these details are presented as provided rather than expanded with assumptions about scheduling or broadcast information.
Final Assessment
The Phoenix Suns vs. LA Clippers game was ultimately decided by a collection of advantages rather than one overwhelming statistical category.
Phoenix scored 114 points, shot 48 percent from the field, made 16 three-pointers, converted 18 of 21 free throws, grabbed 42 rebounds, and recorded 30 assists.
Los Angeles scored 103 points despite shooting 53 percent from the field. The Clippers were led by Zubac’s 21 points and 15 rebounds and Harden’s 13 assists.
The most revealing contrast was therefore between overall field-goal percentage and broader scoring efficiency.
Los Angeles shot better overall, but Phoenix generated more from three-point range and the free-throw line. The Suns also controlled the glass by 15 rebounds.
Booker’s 21-point, 10-rebound, 9-assist performance added another dimension to Phoenix’s victory. His near triple-double reflected the all-around contribution that helped the Suns manage the game’s changing momentum.
The third quarter represented Los Angeles’ strongest challenge. After trailing by 14 at halftime, the Clippers reduced the deficit to five. Phoenix’s 29-point fourth quarter then restored enough control to secure an 11-point win.
For Los Angeles, the game demonstrated both promise and areas of concern. The Clippers shot efficiently from the field, received strong production from Zubac, and got 13 assists from Harden. But the three-point shooting, free-throw conversion, and rebounding numbers worked against them.
For Phoenix, the result represented a balanced team performance. The Suns did not need to dominate every statistical category. They needed to win the categories with the greatest impact, and they did.
That makes the 114-103 score more understandable when viewed through the full statistical picture rather than the final score alone.
Frequently Asked Questions
Who won the Phoenix Suns vs. LA Clippers game on November 9, 2025?
The Phoenix Suns defeated the LA Clippers 114-103 at Intuit Dome in Inglewood, California.
What was Devin Booker’s stat line?
Devin Booker finished with 21 points, 10 rebounds, and 9 assists, putting him one assist short of a triple-double.
Who led the Clippers in scoring?
Ivica Zubac led the Clippers in scoring with 21 points. He also led Los Angeles in rebounds with 15.
How did Phoenix beat Los Angeles despite shooting a lower field-goal percentage?
Phoenix made more three-pointers, shot free throws more efficiently, and won the rebounding battle 42-27. Those advantages outweighed Los Angeles’ superior 53 percent overall field-goal percentage.
How many three-pointers did each team make?
Phoenix made 16 of 38 three-point attempts, while Los Angeles made 10 of 33.
What was the season-series record after the game?
According to the supplied data, Phoenix led the season series 2-1.
Conclusion
The Phoenix Suns vs. LA Clippers matchup on November 9, 2025, was a strong example of why basketball analysis needs more than a final score or field-goal percentage.
Phoenix won 114-103 after building a 60-46 halftime lead, giving up ground during a 34-point Clippers third quarter, and responding with a 29-point fourth quarter.
The Suns’ biggest statistical advantages were their 16 made three-pointers, 86 percent free-throw shooting, 42 rebounds, and 30 assists. Devin Booker provided an all-around performance with 21 points, 10 rebounds, and 9 assists.
Los Angeles had genuine positives. The Clippers shot approximately 53 percent from the field, Ivica Zubac produced 21 points and 15 rebounds, and James Harden recorded 13 assists. Yet their 30 percent three-point shooting, 61 percent free-throw shooting, and 27 total rebounds left them at a disadvantage.
The clearest lesson from the game is that efficiency must be viewed as a complete picture. Phoenix did not win because it shot better from everywhere. It won because its strengths in perimeter scoring, rebounding, free throws, and overall ball movement combined effectively enough to overcome Los Angeles’ strong field-goal percentage.