Celtics vs Pacers Match Player Stats
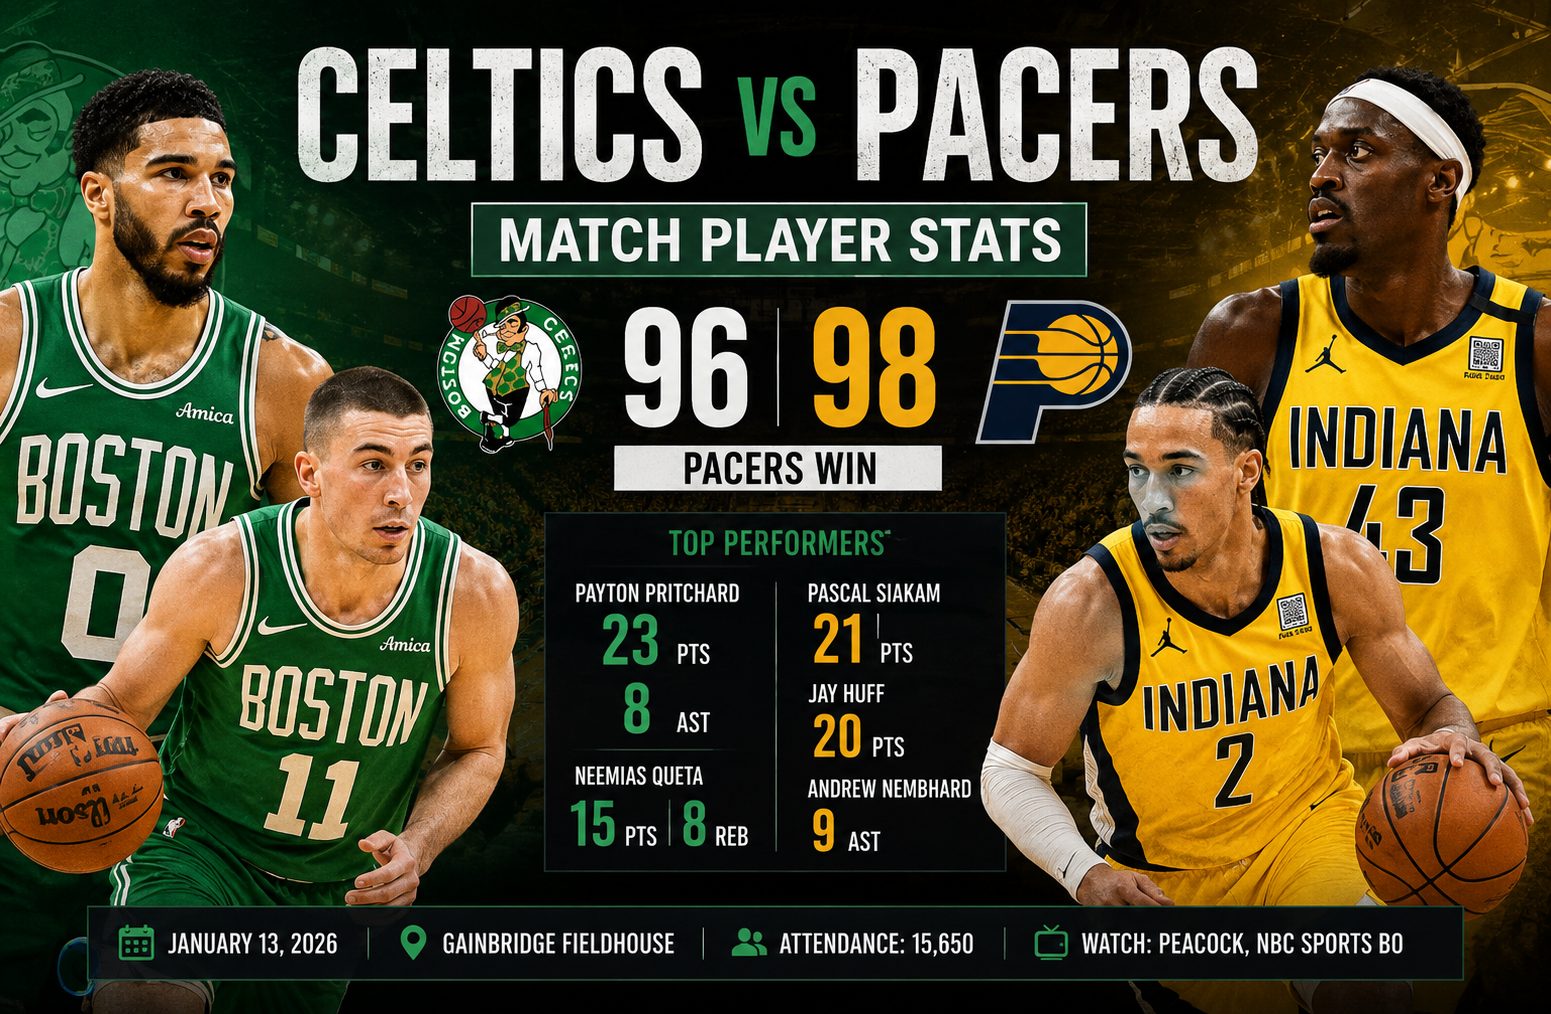
The celtics vs pacers match player stats from the January 13, 2026 matchup show how a two-point NBA game can be decided by shooting efficiency, playmaking, and one late possession rather than simply by the highest scorer. The Indiana Pacers defeated the Boston Celtics 98-96 at Gainbridge Fieldhouse, overcoming a nine-point deficit and surviving Boston’s late comeback attempt. Pascal Siakam delivered the decisive basket with 6.1 seconds remaining, while Payton Pritchard led all scorers with 23 points and eight assists.
The game was particularly interesting because Boston won several traditional statistical battles. The Celtics collected 46 rebounds, scored 54 points in the paint, and held a significant advantage in fast-break points according to Boston’s official game analysis. Indiana, however, created a major advantage from three-point range and produced more assists. That combination helped the Pacers compensate for their lower interior scoring and ultimately win a game that was decided in the final seconds.
For readers looking beyond the final score, this matchup offers a useful example of why individual box-score numbers need context. Pritchard’s 23 points were the game’s highest total, but Siakam’s 21 points carried greater late-game weight. Jay Huff scored 20 points while shooting 4-for-7 from three, and Andrew Nembhard supplied nine assists to keep Indiana’s offense organized. Boston received 18 points from Derrick White, 16 from Anfernee Simons, and 15 from Neemias Queta, but the Celtics could not convert their late opportunities into a win.
Celtics vs Pacers Match Player Stats
The final score was Indiana Pacers 98, Boston Celtics 96. The game was played at Gainbridge Fieldhouse in Indianapolis, with an announced attendance of 15,650.
| Category | Boston Celtics | Indiana Pacers |
| Final Score | 96 | 98 |
| FG | 40-88 | 39-84 |
| FG Percentage | 45% | 46% |
| 3PT | 9-35 | 16-37 |
| 3PT Percentage | 26% | 43% |
| FT | 7-9 | 4-6 |
| FT Percentage | 78% | 67% |
| Rebounds | 46 | 40 |
| Assists | 22 | 29 |
| Turnovers | 12 | 11 |
| Steals | 9 | 8 |
| Blocks | 1 | 3 |
| Offensive Rebounds | 10 | 5 |
| Defensive Rebounds | 36 | 35 |
The most important number in this table is arguably the three-point difference. Boston made nine threes, while Indiana made 16. That seven-make advantage translated into 21 additional points from beyond the arc, which was more than enough to offset Boston’s superiority on the glass and inside the paint.
NBA’s official game page records the same 98-96 final score and quarter-by-quarter progression: Boston led 24-19 after one quarter, Indiana answered with a 34-point second quarter, and the Pacers entered the fourth quarter ahead 79-77. Both teams scored 19 points in the final period.
How the Game Developed Quarter by Quarter
First Quarter: Boston Establishes Control
Boston opened the game more efficiently and finished the first quarter with a 24-19 advantage.
The Celtics used their size and interior presence to generate scoring opportunities while Indiana struggled to match Boston’s early offensive rhythm. The five-point margin was not overwhelming, but it gave Boston an early platform.
The first quarter also reflected the competitive nature of the matchup. According to the Pacers’ official recap, the opening period featured eight lead changes and three ties before Boston closed the quarter with an 8-0 run.
Second Quarter: Indiana Changes the Shooting Equation
The second quarter was the turning point.
Indiana scored 34 points while Boston scored 32, but the Pacers’ offensive explosion was driven by perimeter shooting. Indiana made six three-pointers during a 3:22 stretch, with Jay Huff, Micah Potter, Aaron Nesmith, Quenton Jackson, and Jarace Walker contributing from outside.
That stretch demonstrated one of the central themes of the game: Indiana did not need to dominate Boston physically to stay competitive. Instead, efficient perimeter shooting created a scoring base that Boston could not completely erase.
At halftime, Boston still led 56-53, but Indiana had established the formula it would use for the rest of the game.
Third Quarter: Pacers Take the Lead
The third quarter belonged to Indiana.
The Pacers scored 26 points compared with Boston’s 21, turning the three-point halftime deficit into a 79-77 lead.
Jay Huff was especially important during this phase. He finished with 20 points on 8-of-12 shooting and connected on four of seven attempts from three-point range. His combination of size and perimeter shooting created a difficult defensive problem for Boston.
Indiana’s overall shooting profile also separated the teams. The Pacers finished at approximately 43% from three, while Boston converted only about 26% of its attempts from deep.
Fourth Quarter: A Two-Point Finish
The final quarter was essentially a possession-by-possession battle.
Boston recovered from a 13-point second-half deficit and eventually tied the game at 96. Pritchard’s three-pointer with 2:16 remaining pulled the Celtics within two, and Derrick White then tied the score with a driving basket with 28.6 seconds left.
Indiana called timeout and put the ball in Siakam’s hands.
With 6.1 seconds remaining, Siakam attacked Derrick White, created space near the foul line, and banked in the decisive shot. Boston advanced the ball for one final attempt, but White’s deep three missed.
That sequence explains why the final box score needs to be read alongside game context. The game was not decided by a single scoring leader. It was decided by who executed the final possession.
Boston Celtics Player Stats
Boston’s individual production was led by Payton Pritchard, but several other players played meaningful roles.
Payton Pritchard
23 points, 10-for-22 FG, 3-for-7 3PT, 4 rebounds, 8 assists, 2 steals
Pritchard was Boston’s most productive offensive player and the game’s leading scorer.
His 23 points came on 22 field-goal attempts, and he also created eight assists. That made him central to Boston’s offense throughout the night.
The most important part of his performance was his ability to remain involved late. His three-pointer with 2:16 remaining cut Indiana’s advantage to two and helped initiate Boston’s final comeback.
From a statistical perspective, Pritchard combined scoring volume with playmaking. His eight assists were the highest total for either team except for Nembhard’s nine.
Derrick White
18 points, 7-for-21 FG, 2-for-9 3PT, 4 rebounds, 5 assists, 4 turnovers, +1
White’s performance was mixed but important.
He scored 18 points and added five assists while finishing with a +1 plus/minus. More importantly, he made the tying basket with 28.6 seconds left.
His shooting efficiency was the biggest weakness. White attempted 21 field goals but made seven. His 2-for-9 performance from three also contributed to Boston’s larger perimeter problem.
The final possession should not obscure his overall contribution. White helped Boston recover from its second-half deficit and was directly involved in the closing sequence.
Neemias Queta
15 points, 7-for-9 FG, 8 rebounds, 2 assists, 2 steals, 1 block
Queta was one of Boston’s most efficient scorers.
He converted seven of nine field-goal attempts and tied Sam Hauser for the team lead with eight rebounds. His interior finishing helped Boston generate the 54-38 advantage in points in the paint.
However, his minus-12 plus/minus illustrates why individual efficiency does not always equal overall team impact.
Queta was highly effective when finishing inside, but Indiana’s perimeter shooting changed the structure of the game.
Anfernee Simons
16 points, 7-for-15 FG, 2-for-7 3PT, 3 rebounds, 4 assists, -4
Simons provided important bench scoring for Boston.
He was the Celtics’ leading bench scorer and supplied 16 points in 24 minutes. His seven made field goals gave Boston another source of offense outside its primary starters.
His two three-pointers were useful, but he also experienced the same broader shooting issue that affected Boston. The Celtics needed more consistent perimeter production to match Indiana’s 16 made threes.
Sam Hauser
8 points, 2-for-7 FG, 2-for-7 3PT, 8 rebounds, 1 assist, -6
Hauser’s scoring output was modest, but his eight rebounds were valuable.
He collected two offensive rebounds and six defensive rebounds, giving Boston additional possessions and helping the Celtics win the overall rebounding battle 46-40.
His shooting was less effective. He made only two of seven attempts from three, meaning Boston’s designated perimeter spacing did not produce enough points.
Baylor Scheierman
2 points, 0-for-3 FG, 0-for-2 3PT, 3 rebounds, 2 steals, -8
Scheierman’s offensive production was limited, but he contributed three rebounds and two steals.
Boston received relatively little scoring from this part of the rotation, which increased the burden on Pritchard, White, Queta, and Simons.
Boston’s Rotation Context
Boston was without Jaylen Brown, who missed the game because of lower-back spasms. The official NBA recap notes that Brown was absent, while Pritchard led Boston with 23 points.
That absence matters when evaluating the Celtics’ offensive performance. Brown had been one of Boston’s leading scoring options, so his absence shifted more offensive responsibility toward Pritchard and White.
Boston’s listed inactive players included Luka Garza, Jordan Walsh, Hugo Gonzalez, Chris Boucher, Xavier Tillman, Amari Williams, Ron Harper Jr., and Max Shulga, with Jordan Walsh specifically listed as out because of low-back muscle spasms in the supplied game data.
Indiana Pacers Player Stats
Indiana’s victory was built around balanced contributions rather than one overwhelming statistical performance.
Pascal Siakam
21 points, 10-for-15 FG, 8 rebounds, 6 assists, 2 steals, 1 block, +11
Siakam was the most important player of the game.
His 21 points were not the highest total, but he delivered them with excellent efficiency. He made 10 of 15 field-goal attempts, converted 66.7% from the floor, and added eight rebounds and six assists.
His final shot defined the contest.
With the score tied at 96, Indiana trusted Siakam to create the decisive possession. He attacked White, moved toward the foul-line area, and finished with a high-arcing bank shot.
The official Pacers recap described the performance as one of Siakam’s better games of the season, emphasizing his patience and discipline rather than simply his point total.
That is an important distinction. Efficiency and late-game decision-making were more valuable than chasing a larger scoring total.
Jay Huff
20 points, 8-for-12 FG, 4-for-7 3PT, 3 rebounds, 2 assists, 2 steals, 1 block, +20
Huff was arguably Indiana’s biggest statistical swing player.
His 20 points came on only 12 field-goal attempts. He made four of seven three-point attempts, giving Indiana exactly the type of frontcourt spacing that can disrupt a defense built around protecting the paint.
His +20 plus/minus was the best mark in the game.
That does not mean Huff individually controlled every possession, but it does show how effective Indiana’s lineups were when he was on the court.
Andrew Nembhard
13 points, 5-for-14 FG, 3-for-5 3PT, 6 rebounds, 9 assists, 3 turnovers, 2 steals, +12
Nembhard was Indiana’s primary playmaking engine.
His nine assists were the highest total in the game, and his six rebounds gave him an all-around contribution.
The scoring total of 13 points might appear modest compared with Pritchard’s 23, but Nembhard’s value was more closely connected to how he organized Indiana’s offense.
He also contributed three three-pointers and two steals, making his performance much broader than the scoring column suggests.
Jarace Walker
11 points, 4-for-9 FG, 3-for-5 3PT, 7 rebounds, 1 assist, 1 steal
Walker gave Indiana useful production from the bench.
His three three-pointers were particularly valuable in a game where spacing was critical. He also collected seven rebounds, allowing Indiana to receive both shooting and rebounding value from the same rotation spot.
Johnny Furphy
4 points, 1-for-1 FG, 2-for-2 FT, 5 rebounds, 1 assist, 2 turnovers, 1 steal, +12
Furphy did not score much, but his five rebounds and +12 plus/minus show that his contribution extended beyond scoring.
This is one of the clearest examples of why player evaluation should not focus exclusively on points.
T.J. McConnell
5 points, 2-for-5 FG, 5 assists, +10
McConnell provided five assists in only 15 minutes.
His ability to create offense without requiring high usage helped Indiana maintain ball movement when the primary scorers were not handling every possession.
Quenton Jackson
8 points, 3-for-5 FG, 2-for-4 3PT, 1 assist, 1 block, +6
Jackson supplied efficient bench scoring.
His two three-pointers were especially useful during Indiana’s perimeter-heavy offensive stretch.
Aaron Nesmith
6 points, 2-for-9 FG, 2-for-6 3PT, 5 rebounds, 2 assists, -8
Nesmith struggled with his shooting efficiency, but he contributed five rebounds and two assists.
His two made three-pointers were still part of Indiana’s broader perimeter advantage.
Ben Sheppard
5 points, 2-for-8 FG, 1-for-6 3PT, 2 rebounds, 1 assist, -16
Sheppard had a difficult shooting night and recorded Indiana’s lowest listed plus/minus.
However, his missed shot became part of the late sequence that eventually led to Siakam’s game-winning basket after Siakam tipped in a Sheppard miss earlier in the closing stretch.
The Biggest Statistical Difference: Three-Point Shooting
The strongest explanation for Indiana’s victory is not rebounding, free throws, or overall field-goal percentage.
It is three-point shooting.
Boston:
9-for-35 from three
Indiana:
16-for-37 from three
That is a difference of seven made three-pointers.
Boston actually made one more total field goal, 40 compared with Indiana’s 39. The Celtics also had six more rebounds and scored 16 more points in the paint according to Boston’s official analysis.
Yet Indiana still won.
Why?
Because three-point makes are worth three points each. Indiana’s seven-make advantage from outside represented 21 additional points.
This is the clearest tactical lesson from the game. Boston was more effective inside, but Indiana was much more effective from distance.
Rebounding Did Not Save Boston
Boston finished with 46 rebounds compared with Indiana’s 40.
The Celtics also grabbed 10 offensive rebounds compared with five for Indiana.
On paper, that is a meaningful advantage.
Offensive rebounds can create extra possessions, second-chance opportunities, and pressure on a defense. Boston did receive those benefits.
But the Celtics did not convert their overall possession and interior advantages into enough total points.
This is another reason the game is useful for statistical analysis. A team can win the rebounding battle and still lose because another efficiency category is substantially more important.
Assists Reveal Another Pacers Advantage
Indiana finished with 29 assists, seven more than Boston’s 22.
That difference suggests the Pacers generated a greater proportion of their offense through collective ball movement.
Nembhard led the way with nine assists, while Siakam added six and McConnell contributed five.
Boston’s highest total came from Pritchard with eight.
This does not mean Indiana automatically played better basketball in every offensive category. Boston still produced 54 points in the paint and had a strong individual scoring performance from Pritchard.
However, the assist gap shows how Indiana spread offensive creation across several players.
Turnovers Were Almost Even
Boston committed 12 turnovers.
Indiana committed 11.
That one-turnover difference was relatively small and did not explain the result by itself.
The Celtics did force eight Indiana steals while recording nine steals themselves, so defensive activity was present on both sides.
The more useful conclusion is that Indiana did not need a major turnover advantage to win. The Pacers won while keeping their turnover total close to Boston’s and then gaining the larger benefit from perimeter shooting.
Free Throws Played a Smaller Role
Boston shot 7-for-9 from the free-throw line.
Indiana shot 4-for-6.
Boston therefore had a small advantage in free-throw accuracy and made three more free throws.
But only 15 free-throw attempts were taken by the two teams combined. Boston’s official analysis noted that the game featured very few free throws and that neither team had a free throw attempt in the third quarter.
That meant free throws were never likely to become the primary deciding factor.
Points in the Paint vs Perimeter Efficiency
The game presented a fascinating contrast.
Boston scored 54 points in the paint.
Indiana scored 38.
That is a 16-point advantage for Boston.
Yet Indiana won by two.
This means Indiana effectively overcame Boston’s interior scoring advantage with its perimeter production.
The Pacers’ 16 made threes accounted for 48 points. Boston’s nine made threes accounted for 27.
That 21-point difference from three-point makes more than compensated for Boston’s 16-point paint advantage.
The math is simple, but the strategic lesson is deeper: efficiency in high-value scoring areas can outweigh dominance in another part of the floor.
Plus/Minus Provides More Context
Plus/minus is not a perfect measure of individual performance, but it can help identify which lineups controlled the scoreboard.
Indiana’s best mark belonged to Jay Huff at +20.
Nembhard finished at +12.
Siakam finished at +11.
Johnny Furphy was also +12.
For Boston, White and Pritchard both finished at +1.
Queta finished at -12 despite shooting 7-for-9.
This contrast is important.
Queta’s offensive efficiency was excellent, but Boston’s lineups with him on the floor were outscored overall. Huff, meanwhile, produced 20 points efficiently and had the game’s best plus/minus.
Neither statistic should be interpreted in isolation. Plus/minus reflects lineup performance, opponent combinations, and game context. Still, when combined with the shooting numbers, Huff’s +20 becomes much more meaningful.
The Absence of Jaylen Brown
One major factor in evaluating Boston’s offensive performance is Jaylen Brown’s absence.
Brown did not play because of lower-back spasms. The official NBA recap confirmed that he missed the game, while Boston’s official game analysis also noted his absence.
His absence changed Boston’s offensive hierarchy.
Pritchard became the leading scorer.
White carried a larger scoring and creation burden.
Simons supplied additional bench offense.
Queta became particularly important as an interior scoring option.
Boston still generated 96 points, but the absence of a major scoring option made the team’s perimeter efficiency even more important.
What the Celtics Did Well
Despite the loss, Boston produced several strong statistical indicators.
Strong Interior Scoring
The Celtics scored 54 points in the paint, compared with Indiana’s 38.
That was a clear advantage.
Rebounding Control
Boston won the rebound battle 46-40 and had a 10-5 advantage in offensive rebounds.
Strong Individual Production
Pritchard scored 23.
White scored 18.
Simons scored 16.
Queta scored 15.
That gave Boston four players with at least 15 points.
Late Comeback
Boston erased a 13-point second-half deficit and tied the game in the final minute.
That showed resilience and gave the Celtics a realistic chance to win despite their shooting disadvantage.
What the Pacers Did Well
Indiana’s strengths were different.
Elite Three-Point Efficiency
The Pacers made 16 of 37 three-point attempts.
That was the single biggest statistical advantage.
Better Ball Movement
Indiana recorded 29 assists.
Nembhard’s nine assists were particularly important.
Efficient Siakam Performance
Siakam made 10 of 15 field-goal attempts and contributed across multiple categories.
Late-Game Execution
The Pacers trusted Siakam with the final possession and converted.
That decision produced the game-winning basket.
The Most Important Matchup: Siakam vs White
The final possession effectively became a Siakam-White matchup.
White had just tied the game with a driving basket.
Indiana could have chosen a complicated action involving multiple players, but the Pacers placed the ball in Siakam’s hands.
Siakam attacked, created enough separation, and finished with a bank shot.
That sequence illustrates an important principle in late-game basketball: sometimes the best play is not the most complicated one. It is putting a high-level decision-maker in a position where he can read the defense and create an efficient shot.
The result was a two-point victory.
Celtics vs Pacers Match Player Stats: What the Numbers Really Say
The raw numbers tell a compelling story, but the deeper interpretation is even more useful.
Boston won:
- Rebounds
- Offensive rebounds
- Points in the paint
- Free throws made
- Fast-break scoring
Indiana won:
- Final score
- Three-point makes
- Three-point percentage
- Assists
- Blocks
- Turnover margin
- Late-game execution
That split explains why the game remained competitive despite Indiana’s substantial shooting advantage.
Boston’s statistical profile looked like a team that wanted to win through physicality and interior scoring.
Indiana’s profile looked like a team that wanted to create space, move the ball, and punish defensive coverage from outside.
The final possession then provided the finishing touch.
Season Series Context
This game was the third meeting between Boston and Indiana during the season at that point.
Boston had previously defeated Indiana:
Boston 103, Indiana 95 on December 23
Boston also won:
Boston 140, Indiana 122 on December 27
The January 13 result therefore made the season series 2-1 in Boston’s favor at that stage.
The supplied schedule data also identifies another meeting on January 22, when Indiana defeated Boston 119-104.
That later result is useful when looking at the matchup as a broader season storyline rather than treating the January 13 game as an isolated event.
Why This Matchup Matters for Player Evaluation
The game demonstrates why player evaluation should combine several categories.
If someone looked only at scoring, Pritchard would appear to have been the best offensive player.
He scored 23 points.
But if the question is who had the greatest impact on the final result, Siakam has the stronger case.
He scored 21 points on 10-for-15 shooting, grabbed eight rebounds, produced six assists, made two steals, and scored the decisive basket.
Huff is another excellent example.
His 20 points came on 8-for-12 shooting, including four made threes. His +20 plus/minus was the best in the game.
Nembhard’s nine assists show another form of value.
He did not need to lead Indiana in scoring because his playmaking helped generate opportunities for Siakam, Huff, and the rest of the rotation.
This is why a complete box-score analysis should examine efficiency, playmaking, rebounding, defensive activity, plus/minus, and game situation together.
A Practical Reading Guide for This Box Score
When analyzing a close NBA game, start with these questions:
- Who led in scoring?
- Who was most efficient?
- Which team won the three-point battle?
- Which team controlled the glass?
- Which team created more assists?
- Were turnovers a major factor?
- Which players had the strongest plus/minus?
- Who produced in the final five minutes?
- Were important players unavailable?
- Which statistical advantage actually translated into the final score?
Using that method here produces a much clearer conclusion than simply saying Indiana won 98-96.
Boston’s interior advantage was real.
Its rebounding advantage was real.
Pritchard’s scoring performance was real.
But Indiana’s perimeter efficiency was more valuable over the full game, and Siakam’s late-game execution decided the final possession.
Official Statistical Reference
For readers who want to verify the box score, quarter totals, player statistics, and game information, the official NBA game page provides the complete record for the matchup. official NBA game box score and statistics
Frequently Asked Questions
Who was the top scorer in the Celtics vs Pacers game?
Payton Pritchard was the game’s leading scorer with 23 points. Pascal Siakam led Indiana with 21 points.
Who hit the game-winning shot?
Pascal Siakam hit the game-winning bank shot with 6.1 seconds remaining, giving Indiana a 98-96 victory.
What were Payton Pritchard’s stats?
Pritchard recorded 23 points, 10-for-22 shooting, three three-pointers, four rebounds, eight assists, and two steals.
What were Pascal Siakam’s stats?
Siakam finished with 21 points on 10-for-15 shooting, eight rebounds, six assists, two steals, one block, and a +11 plus/minus.
Which team shot better from three?
Indiana shot substantially better. The Pacers made 16 of 37 three-point attempts, while Boston made nine of 35.
Did Boston win the rebounding battle?
Yes. Boston collected 46 rebounds compared with Indiana’s 40, including a 10-5 advantage in offensive rebounds.
Conclusion
The celtics vs pacers match player stats from this 98-96 Indiana victory reveal a game in which the winning formula was not based on dominating every statistical category.
Boston controlled the boards, scored more points in the paint, and received a game-high 23 points from Pritchard. Queta was extremely efficient around the basket, White helped engineer the late comeback, and Simons provided valuable bench scoring.
Indiana countered with superior three-point shooting, better overall ball movement, and several productive contributors. Huff’s 20 points on efficient shooting gave the Pacers a major boost, Nembhard’s nine assists kept the offense organized, and Siakam provided the complete performance that mattered most when the game reached its final possession.
The decisive difference was the combination of perimeter efficiency and late-game execution. Indiana made seven more three-pointers than Boston, then trusted Siakam to create the final shot after White had tied the game.
For anyone studying celtics vs pacers match player stats, the central lesson is clear: the highest individual scoring total does not always identify the most important player, and winning the rebounding or paint battle does not guarantee victory. In a two-point NBA game, efficiency, lineup impact, shot value, playmaking, and execution in the closing seconds can matter more than any single traditional box-score category.