Red Sox vs Minnesota Twins Match Player Stats
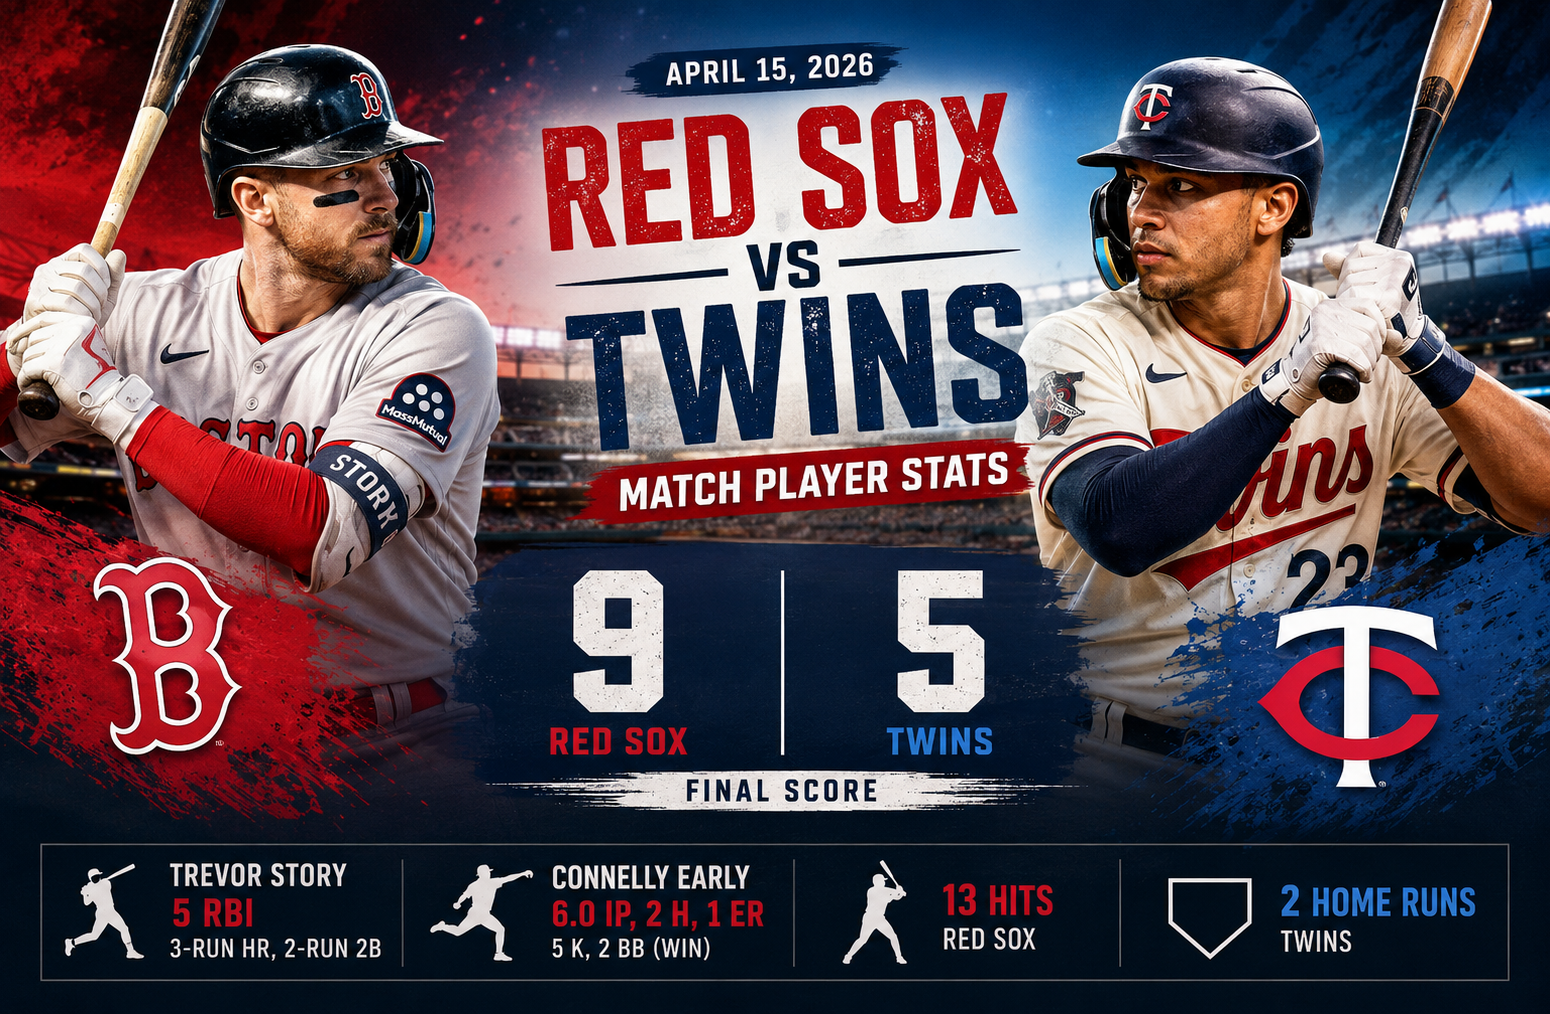
The red sox vs minnesota twins match player stats from April 15, 2026, tell a much more interesting story than the final score alone. Boston defeated Minnesota 9-5 at Target Field, finishing with 13 hits and no errors, while the Twins managed six hits and committed two errors. The biggest individual performance came from Trevor Story, who drove in five runs with a three-run home run and a two-run double. On the mound, Connelly Early delivered six strong innings, allowing only two hits and one earned run while striking out five.
The game was also a useful example of how baseball can change quickly. Minnesota scored first through Austin Martin’s solo home run in the opening inning, but Boston responded with five runs in the third. The Red Sox then added two runs in both the fifth and sixth innings before the Twins mounted a four-run ninth-inning rally. Boston ultimately had enough separation to protect the victory.
For anyone researching the red sox vs minnesota twins match player stats, this article breaks down the important batting, pitching, situational, and game-flow numbers from the matchup. It also explains why the box score matters, which performances deserve the most attention, and what the numbers reveal about how Boston turned an early deficit into a convincing road win.
Red Sox vs Minnesota Twins Match Player Stats: Game Overview
The April 15 matchup was played at Target Field in Minneapolis, with an attendance of 21,276. The game lasted 2 hours and 41 minutes.
Boston entered the game at 7-11 overall and 4-8 on the road. Minnesota was 11-8 and had been particularly strong at home with a 7-3 record.
Despite that difference in early-season records, Boston controlled most of the game after the third inning.
| Category | Red Sox | Twins |
| Runs | 9 | 5 |
| Hits | 13 | 6 |
| Errors | 0 | 2 |
| At-bats | 37 | 33 |
| RBI | 8 | 5 |
| Home Runs | 1 | 2 |
| Walks | 4 | 4 |
| Strikeouts | 7 | 7 |
| RISP | 6-for-15 | 2-for-3 |
| Left on Base | 7 | 6 |
The most important contrast is not simply the home-run count.
Minnesota actually hit two home runs, while Boston hit one. Yet Boston scored four more runs because it created more total offensive opportunities and converted more of them.
Boston’s 13 hits compared with Minnesota’s six. That six-hit advantage was decisive.
The scoring progression
The scoring pattern explains the game particularly well:
- 1st inning: Austin Martin put Minnesota ahead with a solo home run.
- 3rd inning: Boston scored five runs and took control.
- 5th inning: The Red Sox added two more runs.
- 6th inning: Boston scored twice again.
- 9th inning: Minnesota scored four times but could not complete the comeback.
The official MLB game record confirms the 9-5 final score, Boston’s 13 hits, Minnesota’s six hits, and the respective pitching decisions.
How Trevor Story Changed the Game
If one player defines the offensive story of this matchup, it is Trevor Story.
Story finished the game with five RBI. His production came in two major moments that changed the scoreboard.
In the third inning, he hit a three-run home run that extended Boston’s lead to 5-1. The blast traveled 411 feet and left the bat at 101.8 mph, according to the Statcast information attached to the play.
That was followed by another major contribution in the sixth inning when Story delivered a two-run double.
Together, those two extra-base hits accounted for all five of his RBI.
Story’s offensive impact
Story’s performance can be understood in three layers.
First, there was the raw production:
- 5 RBI
- 1 home run
- 1 double
- 3-run home run
- 2-run double
Second, there was timing.
The three-run homer came immediately after Boston had benefited from a defensive mistake by Minnesota. Instead of allowing the inning to remain relatively quiet, Story converted the opportunity into a huge swing in the game.
Third, there was repeat production.
A player can produce one big hit and disappear for the remainder of a game. Story did the opposite. He created damage again in the sixth, helping Boston move from a 7-1 advantage to a 9-1 lead.
That distinction matters when interpreting player statistics. RBI totals are often criticized as context-dependent, and that criticism is fair. But in this particular game, Story’s RBI production was directly connected to high-leverage offensive opportunities.
His performance was not simply a case of accumulating empty numbers.
The Five-Run Third Inning Was the Turning Point
The third inning was the moment that changed the game.
Boston entered the inning trailing 1-0. By the time it ended, the Red Sox were ahead 5-1.
The inning included a pair of runs that came after a rare defensive breakdown by Minnesota second baseman Luke Keaschall. MLB’s game report described the sequence as a double error that allowed two runs to score. Story then followed with his three-run homer on the next pitch.
This sequence demonstrates an important baseball principle: errors become much more damaging when an offense immediately converts them into extra-base production.
A defensive mistake by itself does not guarantee a big inning.
The offense still has to capitalize.
Boston did.
Why the inning mattered statistically
Before the third inning, Minnesota had the only run on the board.
After it:
- Boston led 5-1.
- Story had already produced three RBI.
- Minnesota had given Boston additional outs through defensive mistakes.
- The Red Sox had created a four-run cushion.
- Simeon Woods Richardson had already surrendered six earned runs by the end of his five innings.
That is why looking only at final totals can hide the actual turning point.
The game was not gradually won by Boston.
It was heavily influenced by one explosive inning.
Connelly Early’s Pitching Performance
Connelly Early was arguably just as important as Story.
Early recorded the win after throwing six innings. His line was:
| Pitching Statistic | Connelly Early |
| Innings | 6.0 |
| Hits Allowed | 2 |
| Earned Runs | 1 |
| Walks | 2 |
| Strikeouts | 5 |
| Decision | Win |
| Record | 1-0 |
His most important achievement was limiting Minnesota’s ability to build innings.
The Twins managed only six hits for the entire game, and Early allowed just two of them during his six innings.
The first one was particularly important because it was a home run.
Austin Martin opened the bottom of the first with a solo homer, putting Minnesota ahead immediately. Early did not allow that early setback to dictate the rest of his outing.
Instead, he settled down and kept Minnesota from creating another significant scoring threat while he was in the game. MLB reported that Early became Boston’s first starter of the season to allow two runs or fewer in each of his first four starts.
Early’s efficiency mattered
Early threw 85 pitches, with 52 going for strikes.
That is important context because his previous outings had involved difficulty working deep into games despite limiting runs.
Against Minnesota, he reached six full innings for the first time in the season.
That gave Boston’s offense enough time to build its advantage without forcing the bullpen to cover a large portion of the game.
The relationship between starting pitching and offensive performance is often overlooked in a box-score discussion.
Here it was obvious.
Early gave Boston six innings of stability, and the offense turned that stability into a large lead.
Simeon Woods Richardson Struggled Under Pressure
Minnesota starter Simeon Woods Richardson had a difficult afternoon.
His final line:
| Pitching Statistic | Simeon Woods Richardson |
| Innings | 5.0 |
| Hits Allowed | 10 |
| Earned Runs | 6 |
| Walks | 3 |
| Strikeouts | 3 |
| Decision | Loss |
| Record | 0-3 |
The most damaging number is the 10 hits allowed in only five innings.
Boston did not merely wait for walks or rely on one home run. The Red Sox repeatedly put the ball in play and found gaps.
That is reflected in the team’s 13-hit total.
Woods Richardson also allowed six earned runs. His official ERA entering the game was already a concern, and the outing made the early-season results even more difficult.
The contrast between the starters
The difference between the two starting pitchers was substantial.
Early:
- 6.0 innings
- 2 hits
- 1 earned run
- 5 strikeouts
- 2 walks
Woods Richardson:
- 5.0 innings
- 10 hits
- 6 earned runs
- 3 strikeouts
- 3 walks
Boston’s starter provided length and run prevention.
Minnesota’s starter gave up frequent contact and could not prevent the Red Sox from creating a large middle-inning advantage.
That difference was a major reason the game moved in Boston’s direction.
Boston’s Offensive Approach
The Red Sox finished with 13 hits, eight RBI, four walks, and one home run.
Their team batting line was:
37 at-bats, 9 runs, 13 hits, 8 RBI, 1 home run, 4 walks, and 7 strikeouts.
The most useful number may actually be the combination of hits and runners in scoring position.
Boston went 6-for-15 with runners in scoring position.
That is a .400 success rate in those situations.
It does not mean every scoring opportunity resulted in a run, but it shows that Boston was effective when the situation demanded productive contact.
Boston’s extra-base production
The Red Sox recorded doubles from:
- Trevor Story
- Andruw Monasterio
- Masataka Yoshida
Story’s double was especially important because it produced two runs.
The Red Sox therefore received offensive value from multiple forms of contact:
- Singles created traffic.
- Doubles moved runners into scoring position.
- Story’s home run cleared the bases.
- Walks extended opportunities.
- Situational hitting converted those opportunities into runs.
This is a more complete offensive performance than a team simply relying on home runs.
Minnesota’s Offensive Production
Minnesota finished with six hits, five runs, two home runs, four walks, and seven strikeouts.
The Twins’ two home runs came from Austin Martin and Ryan Kreidler.
Martin’s homer was especially notable because it gave Minnesota the initial lead.
Kreidler’s contribution came much later.
In the ninth inning, with Boston leading 9-1, Kreidler hit a three-run homer that cut the deficit to 9-5.
The Twins also scored another run in the ninth on Brooks Lee’s RBI single.
That late rally made the final score appear closer than most of the game actually was.
The ninth inning needs context
A four-run ninth inning is significant, but it should not be interpreted as evidence that Minnesota controlled the late stages of the game.
Boston entered the inning with an eight-run advantage.
Minnesota’s rally reduced that advantage to four, but Boston still closed out the victory.
The late surge does, however, show that the Twins continued to compete rather than simply going through the motions.
Kreidler’s three-run homer was one of the most important individual offensive moments for Minnesota even though it did not change the result.
Ryan Kreidler’s Three-RBI Performance
Kreidler led the Twins with three RBI.
His ninth-inning home run accounted for all three.
That gives him a notable statistical line despite the defeat.
This is a good example of why player statistics should always be separated from team results.
A player can produce excellent individual numbers in a losing game.
Kreidler’s three RBI were legitimate offensive contributions. They simply arrived too late to change the outcome.
His performance also helped Minnesota avoid a more one-sided final score.
Austin Martin Provided the Early Spark
Austin Martin’s first-inning home run gave Minnesota the opening advantage.
The homer traveled 406 feet and put Early under immediate pressure.
That was meaningful because Boston had lost the first two games of the series.
Minnesota entered the finale looking for a sweep, while Boston needed a response.
The Twins got the first punch.
Boston delivered the stronger response.
That sequence is one of the clearest themes in the game.
The Red Sox Won the Situational Battle
One of the most useful ways to analyze these numbers is through situational hitting.
Boston went 6-for-15 with runners in scoring position.
Minnesota went 2-for-3.
At first glance, Minnesota’s percentage looks better.
But the raw opportunity count matters.
Boston had 15 RISP opportunities compared with only three for Minnesota.
That tells us something important.
Boston consistently created situations where multiple runs could score.
Minnesota did not generate nearly as many opportunities despite converting two of its three chances.
This is why RISP percentage should not be interpreted in isolation.
A team can go 2-for-3 and score fewer runs than a team going 6-for-15 because the second team created many more opportunities.
Defensive Performance Was Another Major Difference
The defensive line was straightforward:
- Boston: 0 errors
- Minnesota: 2 errors
The two Twins errors were both charged to Luke Keaschall.
More importantly, those mistakes were costly.
They occurred during Boston’s five-run third inning and helped extend the inning before Story delivered the three-run homer.
Boston did not commit an error.
That clean defensive performance gave the Red Sox a reliable foundation while their offense built its lead.
Why errors matter beyond the box score
An error is not simply one mark in the E column.
It can:
- Extend an inning.
- Increase the opposing team’s number of baserunners.
- Force a pitcher to face additional hitters.
- Create RBI opportunities.
- Change the pitcher’s strategy.
- Increase the probability of extra-base damage.
That is essentially what happened in the third inning.
Minnesota’s defensive mistake created an environment in which Boston could produce a much larger inning.
Boston’s Pitching Staff After Early
The Red Sox pitching staff completed nine innings with:
- 6 hits allowed
- 5 runs allowed
- 5 earned runs
- 4 walks
- 7 strikeouts
- 2 home runs allowed
Early handled the first six innings.
Boston’s bullpen then protected the lead for the final three.
The ninth inning was not perfect.
Minnesota scored four runs.
But the important point is that Boston entered the ninth with enough margin to withstand that rally.
This is one reason the earlier offensive production mattered so much.
If Boston had entered the ninth leading 5-1 rather than 9-1, the outcome could have become much more uncomfortable.
The Twins’ Pitching Staff Had a Difficult Night
Minnesota’s pitching line was:
- 9 innings
- 13 hits allowed
- 9 runs
- 8 earned runs
- 4 walks
- 7 strikeouts
- 1 home run allowed
The most revealing statistic is the 13 hits allowed.
Boston’s offense repeatedly reached base through contact.
The Twins also committed two errors, meaning the defense contributed to the problem.
This combination is especially difficult to overcome:
Frequent hits + defensive mistakes + timely extra-base hits
That is essentially the recipe for a large opponent scoring total.
Why the Final Score Was 9-5
The scoreboard can be explained through four main factors.
1. Boston created more baserunners
The Red Sox had 13 hits compared with six for Minnesota.
That created a much larger number of scoring opportunities.
2. Story converted opportunities into damage
His five RBI accounted for more than half of Boston’s eight RBI.
His three-run homer was the biggest single offensive swing of the game.
3. Early prevented Minnesota from answering
After allowing Martin’s first-inning home run, Early limited the Twins to one additional hit and no further earned runs during his outing.
4. Boston built its lead before the ninth
The Red Sox led 9-1 entering the final inning.
Minnesota’s four-run rally therefore became a late reduction of the deficit rather than a true comeback.
What the Player Stats Reveal That the Score Does Not
The final score says Boston won by four runs.
The player statistics tell us how.
Boston’s 13 hits were more important than its one home run.
Story’s five RBI were more important than his home run alone.
Early’s six innings were more important than his five strikeouts alone.
Minnesota’s two home runs were not enough because the Twins did not create enough additional traffic.
This is the value of looking beyond runs.
The game was won in the middle innings
Boston scored:
- 5 runs in the third
- 2 runs in the fifth
- 2 runs in the sixth
That is nine runs across three innings.
Minnesota scored:
- 1 run in the first
- 4 runs in the ninth
The distribution is striking.
Boston’s offense controlled the middle portion of the game, while Minnesota’s biggest response came after the result was largely decided.
Series Context
The victory prevented Boston from being swept.
Minnesota had won the first two games:
- Game 1: Twins 13, Red Sox 6
- Game 2: Twins 6, Red Sox 0
- Game 3: Red Sox 9, Twins 5
The Twins therefore won the series 2-1.
That context matters.
Boston’s victory did not erase the problems exposed during the first two games, but it gave the Red Sox a positive ending to the series.
It also prevented the road trip from finishing on an even more difficult note.
MLB’s game report noted that the victory gave Boston a 3-3 road trip and highlighted Early’s role in helping the club respond after the first two losses.
What Stands Out Most From the Red Sox
Three things stand out.
Trevor Story delivered in the biggest moments
Five RBI is the obvious headline.
But the timing is what makes the performance particularly valuable.
His three-run homer transformed the third inning, and his two-run double added further insurance later.
Connelly Early provided stability
Early did not simply earn a win.
He gave Boston six innings of quality pitching when the club needed it.
After two difficult starts by Boston’s previous starters in the series, that stability was especially valuable.
The offense did not depend on one player
Although Story dominated the RBI column, Boston collected 13 hits.
That indicates broader offensive participation.
The Red Sox received doubles from Story, Monasterio, and Yoshida, while Connor Wong also contributed an RBI sacrifice bunt.
The offense therefore produced in different ways.
What Stands Out Most From the Twins
Minnesota’s best individual offensive moments came from Austin Martin and Ryan Kreidler.
Martin gave the Twins an early lead with his home run.
Kreidler provided three RBI in the ninth.
But the middle innings were the problem.
Minnesota had difficulty generating sustained offense against Early and then had to deal with a large Boston lead.
Defensively, the two errors were also costly.
The combination made it difficult for the Twins to maintain control after their strong opening.
Player Performance Summary
| Player | Team | Key Contribution |
| Trevor Story | Red Sox | 5 RBI, 3-run HR, 2-run double |
| Connelly Early | Red Sox | 6 IP, 2 H, 1 ER, 5 K |
| Andruw Monasterio | Red Sox | RBI double |
| Masataka Yoshida | Red Sox | RBI groundout and double |
| Connor Wong | Red Sox | RBI sacrifice bunt, stolen base involvement in team offense |
| Austin Martin | Twins | 406-foot solo HR |
| Ryan Kreidler | Twins | 3 RBI, 3-run HR |
| Brooks Lee | Twins | Ninth-inning RBI single |
| Simeon Woods Richardson | Twins | 5 IP, 10 H, 6 ER |
The table makes one point especially clear: Boston had greater production spread across the game, while Minnesota’s largest individual offensive contributions came at opposite ends of the contest.
A Closer Look at Boston’s Run Creation
Boston’s nine runs came from several different situations.
The third inning produced five.
That inning combined defensive mistakes, an RBI groundout, and Story’s home run.
The fifth inning produced two more through an RBI double from Monasterio and a sacrifice bunt from Wong.
The sixth inning added another two through Story’s double.
This is a textbook example of layered run creation.
Boston did not need to hit five home runs.
It created a big inning, manufactured runs, then used extra-base hitting to add insurance.
That is a more sustainable offensive formula than relying exclusively on the long ball in a single game.
A Closer Look at Minnesota’s Run Creation
Minnesota’s five runs came through a very different pattern.
Martin’s first-inning homer accounted for the opening run.
Then the Twins went scoreless for seven consecutive innings.
Their remaining four runs arrived in the ninth.
Kreidler’s three-run homer was responsible for most of the late scoring.
The distribution tells us that Minnesota had isolated moments of power but lacked consistent offensive pressure through the middle of the game.
That is why the Twins’ two-home-run advantage did not translate into a win.
Home Runs Versus Overall Hitting
The home-run totals were:
Twins: 2
Red Sox: 1
Yet the score was:
Red Sox: 9
Twins: 5
This is one of the strongest reminders that home-run count is only one part of offensive evaluation.
Boston had:
- 13 hits
- 3 doubles
- 1 home run
- 4 walks
- 9 runs
Minnesota had:
- 6 hits
- 2 home runs
- 4 walks
- 5 runs
The Red Sox generated seven more hits.
That difference overwhelmed Minnesota’s advantage in home runs.
What RISP Tells Us About the Game
Boston’s 6-for-15 performance with runners in scoring position deserves attention.
It means Boston produced a hit in 40 percent of its official RISP opportunities.
More importantly, the Red Sox repeatedly put themselves into those situations.
Minnesota went 2-for-3.
The Twins were actually more efficient by percentage, but they had far fewer opportunities.
This is why analysts should consider both:
Conversion rate
and
Opportunity volume
Boston’s offense won the second category decisively.
The Importance of Pitching Ahead in the Count
While the provided box-score data does not include every pitch-level count, the overall results illustrate the importance of limiting damage.
Early allowed two hits over six innings.
Woods Richardson allowed ten hits over five.
The difference in contact volume was enormous.
Boston’s hitters repeatedly reached base and forced Minnesota to defend against additional scoring situations.
Minnesota did not have the same level of sustained success against Early.
The result was a game in which one starter protected a lead while the other struggled to prevent one from developing.
Why This Game Matters for Evaluating Players
A single baseball game should never be treated as proof that a player has permanently changed his talent level.
That is especially important early in a season.
Instead, individual games are best viewed as evidence of what happened under a particular set of conditions.
Story demonstrated high-impact offensive execution.
Early demonstrated improved length and efficiency.
Kreidler demonstrated late-game power.
Martin demonstrated early-game power.
Those are valid observations.
But they should not automatically be turned into claims about entire seasons.
That distinction is essential when using player statistics responsibly.
How to Read This Box Score Correctly
If you are using the red sox vs minnesota twins match player stats for fantasy baseball research, historical analysis, team evaluation, or simply to understand the game, focus on the following order:
- Look at the final score.
- Compare total hits.
- Review starting-pitcher performance.
- Identify extra-base hits.
- Examine RBI and scoring opportunities.
- Check defensive errors.
- Look at RISP results.
- Review the inning-by-inning scoring.
- Consider when the runs were scored.
- Separate individual performance from team outcome.
This approach produces a much clearer interpretation than focusing on one headline statistic.
Key Takeaways From the Match
The most important numbers from the game are easy to summarize.
Boston’s 13 hits: The foundation of the nine-run offense.
Trevor Story’s five RBI: The biggest individual offensive contribution.
Story’s 411-foot home run: The signature swing of the afternoon.
Connelly Early’s six innings: The pitching foundation for the victory.
Minnesota’s six hits: Evidence of Boston’s overall run prevention.
Two Twins errors: A major contributor to Boston’s five-run third inning.
Boston’s 6-for-15 with RISP: Strong production in important situations.
Minnesota’s four-run ninth: A meaningful late rally that still came too late.
9-5 final score: Boston avoided the sweep while Minnesota still won the series 2-1.
Frequently Asked Questions
What were the Red Sox vs Minnesota Twins match player stats on April 15, 2026?
Boston recorded 13 hits and nine runs in a 9-5 victory. Trevor Story was the standout hitter with five RBI, including a three-run home run and a two-run double. Connelly Early earned the win with six innings of two-hit, one-run pitching.
Who was the best player in the Red Sox vs Twins game?
Trevor Story was the most influential offensive player. He produced five RBI through a three-run homer and a two-run double. Connelly Early was the most important pitcher after allowing only two hits and one earned run across six innings.
How many RBI did Trevor Story have against the Twins?
Trevor Story had five RBI. He drove in three runs with his third-inning home run and two more with a sixth-inning double.
How did Connelly Early pitch against Minnesota?
Early pitched six innings and allowed two hits, one earned run, and two walks while striking out five. He earned his first win of the season.
How many home runs did the Twins hit?
Minnesota hit two home runs. Austin Martin hit a solo homer in the first inning, while Ryan Kreidler hit a three-run homer in the ninth.
Did the Twins win the series?
Yes. Minnesota won the three-game series 2-1. The Twins won the first two games before Boston won the April 15 finale 9-5.
Conclusion
The red sox vs minnesota twins match player stats from April 15, 2026, show a game that was shaped by timely offense, strong starting pitching, and one decisive middle-inning explosion.
Boston finished with 13 hits and nine runs, while Minnesota had six hits and five runs. Trevor Story supplied the biggest offensive performance with five RBI, including a three-run homer and a two-run double. Connelly Early provided the pitching performance Boston needed, going six innings while allowing just two hits and one earned run.
The most important sequence was the third inning. Boston turned Minnesota’s defensive mistakes into additional opportunities and then used Story’s power to produce a five-run frame. From there, the Red Sox continued adding insurance in the fifth and sixth innings.
Minnesota’s ninth-inning rally made the final score more competitive, but it could not erase the advantage Boston had built earlier.
The broader lesson from the box score is that baseball games are rarely explained by one number. Minnesota had more home runs, yet Boston won comfortably because the Red Sox generated far more hits, created more scoring opportunities, received better starting pitching, and converted key chances at important moments.
For a complete official record of the game, the MLB game coverage is the most appropriate primary reference. MLB official game coverage